
- XRP fell by 15.77% to $2.42 after a 10.46% drop, driven by SEC appeal uncertainty and heavy selling pressure testing $1.71 support.
- Bearish technicals: RSI at 34.32 near oversold, MACD shows rising downside momentum, with resistance at $2.50 and $3.00.
- If XRP holds $2.00, a rebound to $2.50-$2.80 is possible; failure may push prices toward $1.70-$2.00 amid strong bearish sentiment.
XRP has had a sharp decline on February 3, falling by 15.77% after a 10.46% drop the previous day, closing at $2.42. The drop followed continued uncertainty surrounding the SEC’s appeal decision, which is a crucial factor influencing XRP’s price movement.
A withdrawal could lead to gains, while proceeding with the appeal may extend the downtrend. XRP’s market cap has decreased by 16.46% to $138.57 billion, leading to Tether overtaking it as the third largest digital asset with a market cap of $139.51 billion.


XRP’s Heavy Selling Pressure
XRP’s price showed an increased drop, with a large bearish daily candlestick showing strong selling pressure. XRP surged above $3 but reversed sharply, testing a low of $1.71. This level may serve as intraday support if buying pressure increases.
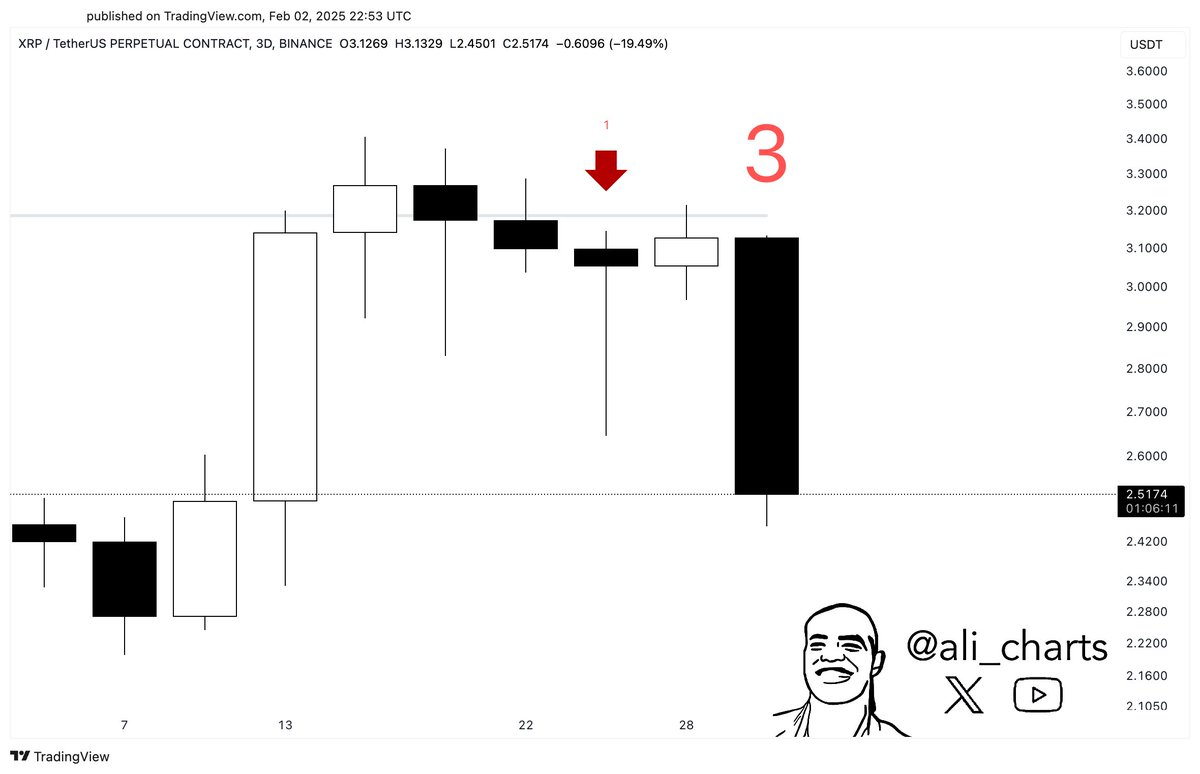
Source: Ali
The downturn followed an extended uptrend since October 2024, where volatility and trading volumes were high. The recent sell off suggests either a correction or a potential trend shift.
XRP has a trading volume of $33.77B, an increase of 407.79% in the past day. Increased volume during a decline indicates aggressive selling. If this trend continues, downward pressure could persist in the short term. According to Ali, the TD Sequential indicator suggested selling XRP a week ago, indicating bearish sentiment.
Technical Indicators Show Bearish Momentum
XRP’s RSI has dropped to 34.32 from a peak of 57.53. This indicates that XRP is nearing oversold levels, though a further dip below 30 could lead to extended losses. If RSI stabilizes, a potential recovery may be evident around key support levels.
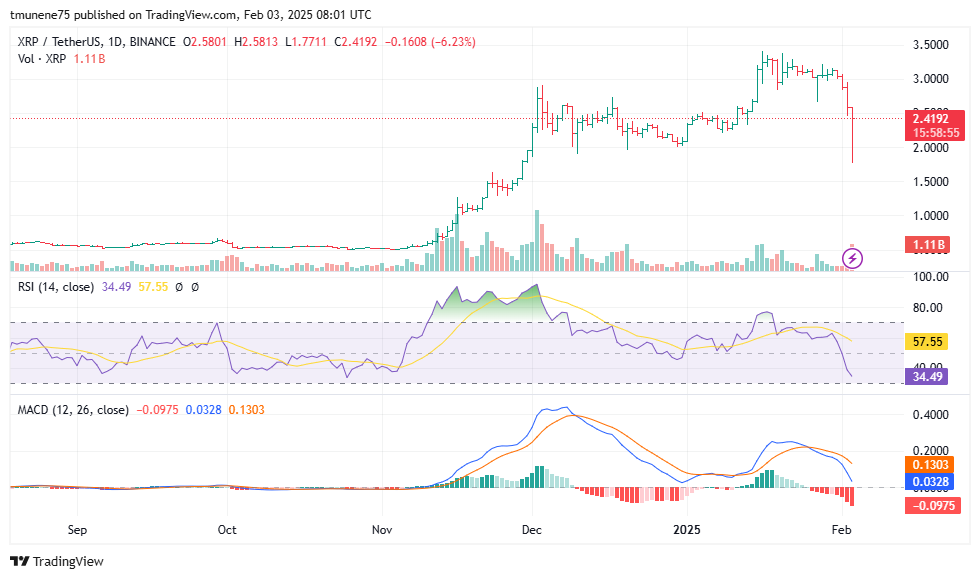
Source: TradingView
The MACD shows a bearish trend, with the MACD line crossing below the signal line. The negative histogram reading of -0.0975 suggests increasing downward momentum. Unless buying pressure strengthens, further declines remain possible.
Support and Resistance Levels
If XRP holds above $2.00, it may stabilize, but a break below could test $1.71 or even $1.50. Resistance is at $2.50, with barriers at $3 and $3.30. If sellers maintain control, the digital asset could extend its decline toward lower support zones.
According to Egrag Crypto, XRP could drop as low as $2.30, with $1.90 acting as a last defense level. If $3 remains untested, bearish sentiment could dominate in the short term.
For February 4, XRP’s likely trading range depends on market conditions. A bullish scenario could see prices recovering to $2.50-$2.80, while a bearish outcome might push XRP to $1.70-$2.00.


