
- XRP risks further decline if it fails to maintain support above the $2.45 level
- Bullish MACD crossover and RSI near 60 point to short-term upward momentum
- Increased volume and liquidations signal high volatility driven by leveraged trades
XRP has encountered a notable pullback in the past 24 hours, triggering concern among short-term investors and traders. After reaching an intraday high of $2.5863, the price slipped to $2.46, marking a 5.91% decline. This movement aligns with a broader trend of volatility that has gripped the cryptocurrency market recently.
Despite the setback, indicators suggest XRP remains in a phase of positive momentum, albeit within a highly reactive market. The increase in trading volume, up by over 8% to $4.89 billion, further points to strong market activity, likely driven by liquidations and strategic repositioning by leveraged traders.


Key Technical Levels Signal Caution
The immediate support level lies at $2.45, only a fraction below the current price. If XRP breaks beneath this level, the next psychological zone to monitor would be around $2.40.
Historically, this area has acted as a soft floor during periods of price consolidation. Failure to hold above $2.45 could invite further downside pressure.
On the flip side, resistance remains stiff between $2.60 and $2.65. This price range saw repeated rejection during past attempts to rally, suggesting strong selling interest. A clean break above $2.60 would require significant buying volume and market sentiment to shift. Until that happens, XRP may trade sideways or trend slightly lower.
Indicators Reflect Mixed Sentiment
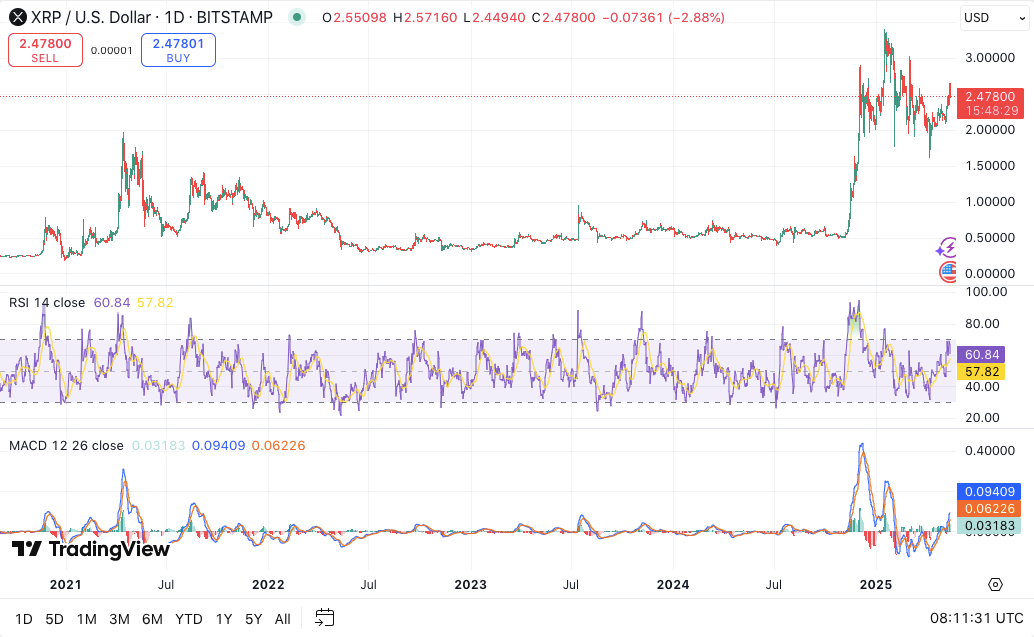
The RSI, currently at 60.70, signals growing bullish momentum but remains safely below the overbought threshold of 70. This suggests that while XRP is experiencing upward force, there’s room for further gains before any major correction. However, traders should remain cautious as historical patterns show price peaks when RSI pushes past 70.
Moreover, the MACD indicator reveals a recent bullish crossover. The MACD line at 0.09392 sits above the signal line at 0.06222. This formation is typically seen before short-term rallies, hinting at renewed upward strength. The histogram also supports this view with positive values, indicating a continuation of this bullish wave at least in the near term.
Volatility Driven by Liquidation Surges
XRP’s price movements continue to be shaped by leveraged trading activity. The asset has shown a tendency to trigger liquidations during both sharp declines and rapid gains.
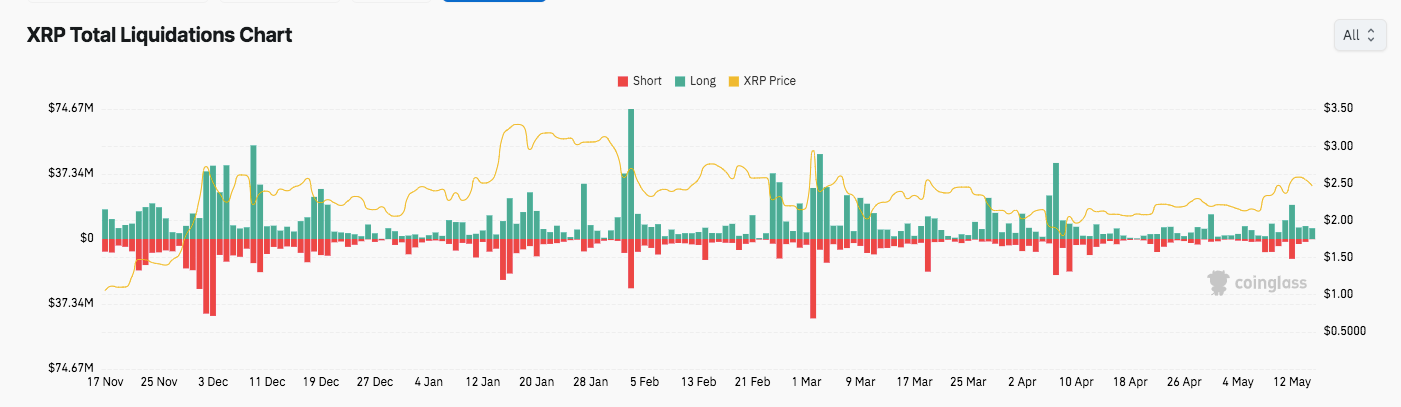
Previous peaks in liquidation activity occurred near $2.00 and $2.50, areas where prices have historically reversed. This suggests a repeating cycle of over-leveraged positions getting flushed out near key levels.
Consequently, while XRP’s fundamentals remain intact, the immediate trend hinges on how it handles support at $2.45. A sustained break below could alter the short-term outlook significantly.


