- XRP rally nears ATH as analysts debate between breakout or potential correction
- Historical cycle analysis projects XRP could reach $20 if trends continue upward
- Bullish MVRV crossover reappears, but RSI overbought zone hints at consolidation
XRP has surged near its all-time high, gaining over 19% in the past week and reaching a new local peak of $3.6. This rally follows a steady consolidation phase and a strong comeback from earlier price dips.
With bullish technical indicators and historical comparisons pointing toward significant upside potential, analysts are divided on whether XRP can continue higher or if a reversal is due. The current market cap stands at $211.3 billion, with a 24-hour volume of $8.34 billion, signaling heightened investor interest.


Historical Cycles Reveal XRP’s Potential for Massive Upside
EGRAG CRYPTO, a known analyst, examined XRP’s trajectory using past cycle performance. The 2017 cycle suggested an extreme upside scenario targeting $33. The 2021 cycle, in contrast, pointed to a more conservative $7.70 price level.
Averaging both targets brings a projection near $20 for the upcoming cycle. While this figure may appear ambitious, it aligns with the kind of exponential moves observed in previous bull runs. Hence, if history repeats or rhymes, a breakout to double digits could remain within reach.
#XRP – Not Even Considering the Measured Move! 🚀💭:
— EGRAG CRYPTO (@egragcrypto) July 21, 2025
Let’s take a look at the potential based on previous cycles:
Historical Insights:
2017 Cycle: If we reference this cycle, we could see #XRP reaching an impressive $33! 💰✨
2021 Cycle: From this cycle, a potential price of… pic.twitter.com/bxVBOoQkD2
Bullish MVRV Crossover Resurfaces as MACD and RSI Show Strength
Ali Martinez highlighted an important on-chain metric, the MVRV Ratio. This ratio compares the market value to the average price of XRP held by investors. Significantly, the 200-day Moving Average of the MVRV Ratio helps identify long-term value trends.
According to Martinez, every time XRP’s MVRV crosses above this long-term average, a strong rally has followed. This pattern reappeared just before XRP soared past the $2 level in late 2024. That move led to a high of $3.4 in January 2025 and laid the foundation for the current rally.
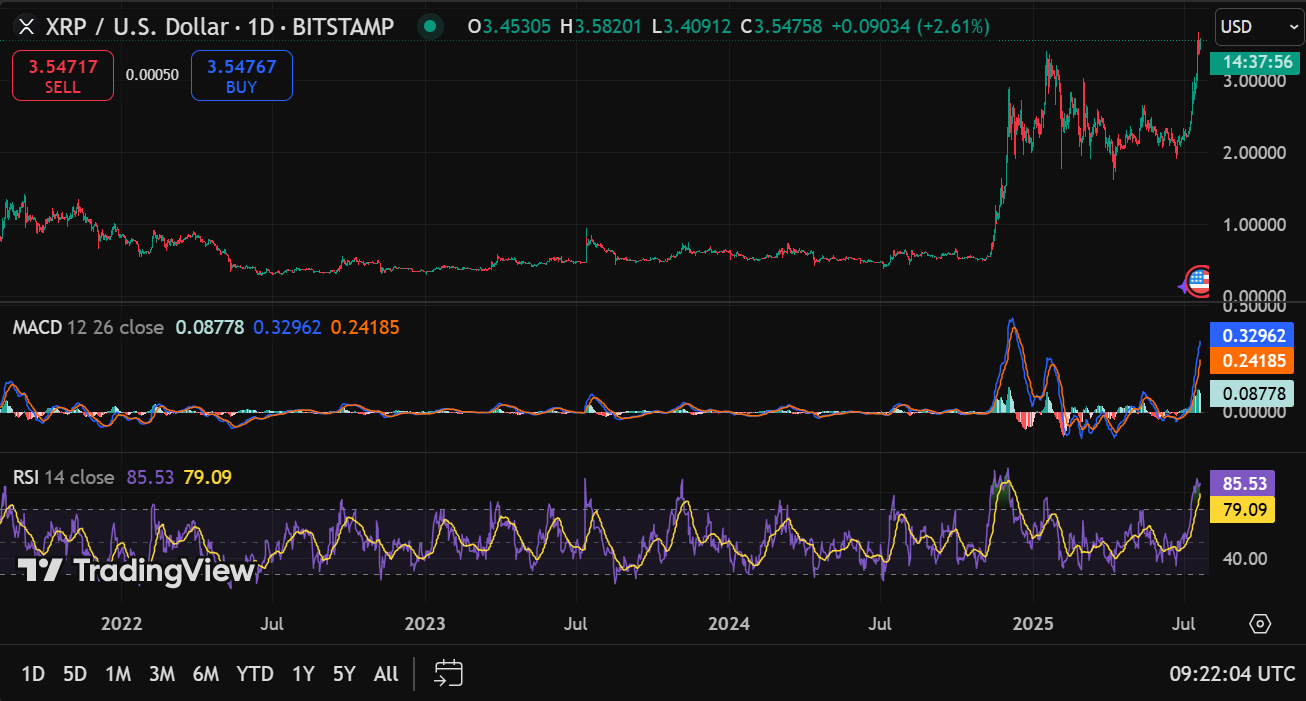
Besides, technical indicators support continued bullishness. The MACD remains in positive territory, although the MACD line now trails the signal line slightly. This suggests that momentum is still bullish but might be slowing.
Furthermore, the RSI has reached 85.75, well above the overbought threshold of 70. This extreme reading hints at possible short-term consolidation or a minor pullback.


