
- XCN surged by 12% to $0.01640, with volume up by 103% and RSI at 58.34, indicating bullish short-term momentum.
- The token reclaimed its 50-day MA and is now testing resistance between $0.0175 and $0.0180.
- Increased daily active addresses and a bullish MACD crossover hint at a possible trend reversal if $0.018 breaks.
Onyxcoin (XCN) recorded a sharp price rebound on June 26, trading at $0.01640 after rising by 12% within 24 hours. Over the past week, XCN gained by 15%, but still remains down by 12.65% over the past month.
The recent bounce pushed the token’s market cap to $550.94 million, an 11.66% increase. Additionally, 24-hour trading volume jumped to $64.4 million, a surge of 103.04%, suggesting stronger market participation. These follow a prolonged downtrend that started in mid-January after XCN peaked near $0.047.


Volume Uptick and RSI Support Short-Term Momentum
XCN’s trading activity has increased majorly. According to CoinMarketCap, 24-hour volume now represents 11.67% of the market cap, which shows increased liquidity. The volume is at 1.79 million XCN, supporting the recent bullish price movement.
This surge coincides with an important price recovery from the $0.0115–$0.0120 support area. Technical indicators confirm this short-term upside momentum. The RSI rose to 58.34, moving above the neutral 50 level.
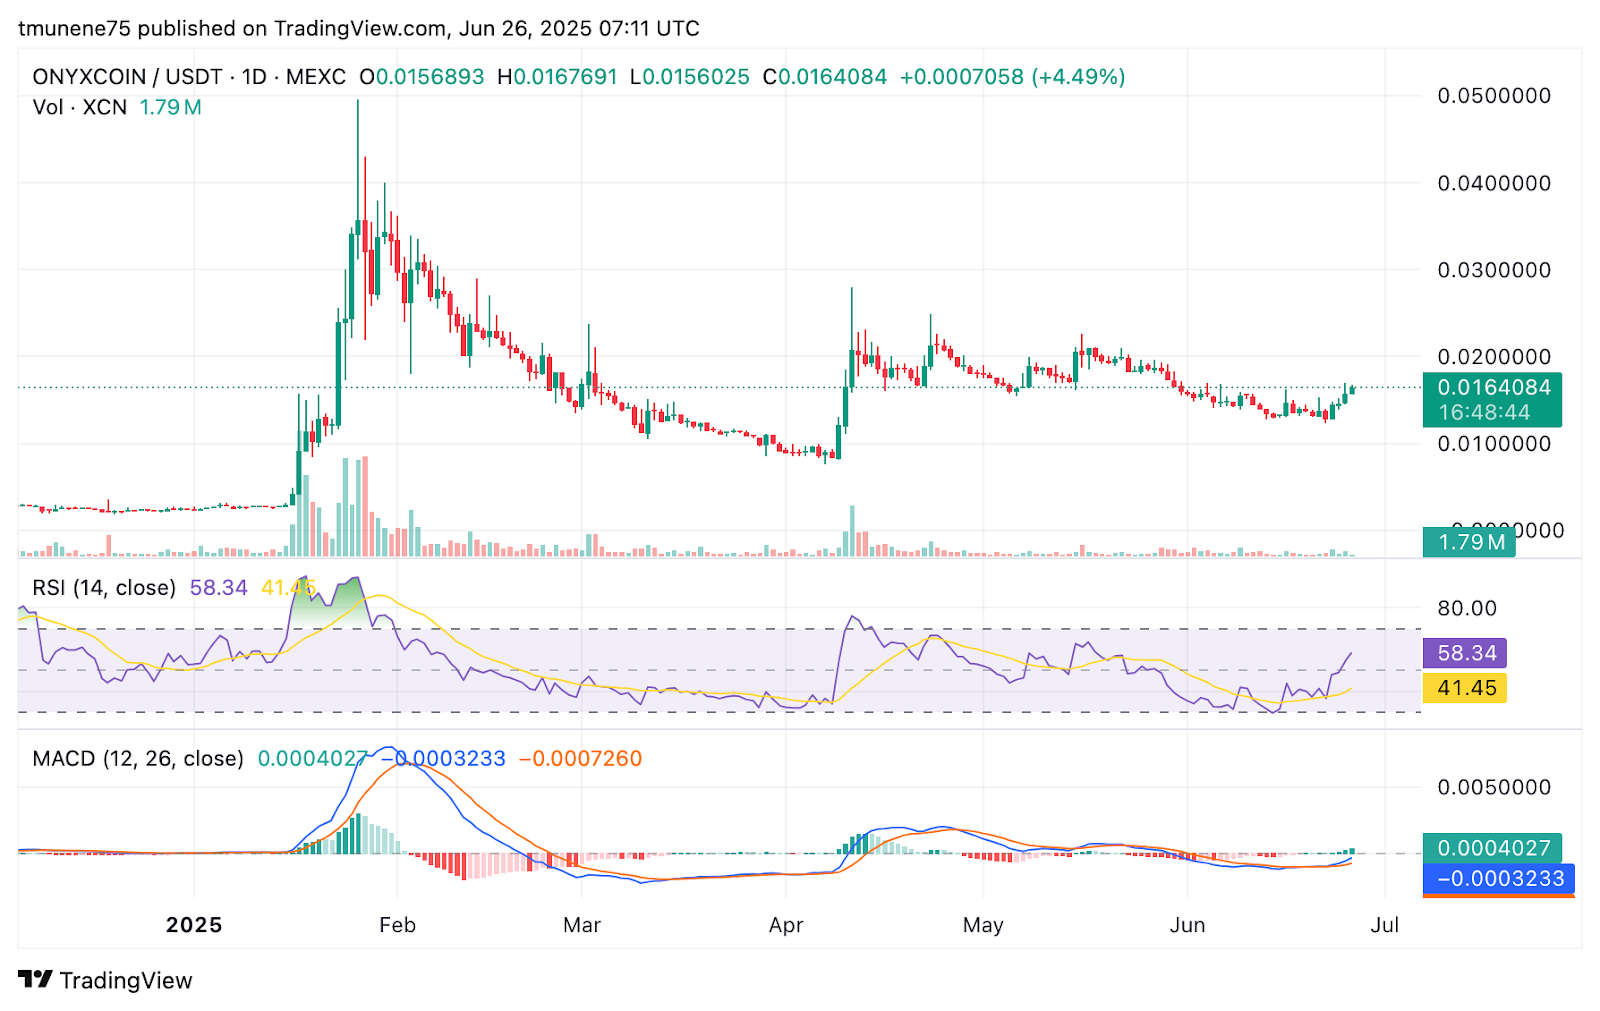
Though it has not crossed into overbought levels, it suggests bulls still have the potential to advance. The MACD indicator showed a bullish crossover. The MACD line, now at 0.0004027, has moved above both the signal line at −0.0007260 and the zero line.
Resistance Levels and Moving Averages
Following the extended correction from January through May, XCN traded below both its 50 and 200-day moving averages. However, that trend may be reversing. XCN has reclaimed the 50-day MA at $0.015 and is now testing the $0.0175–$0.0180 resistance range.
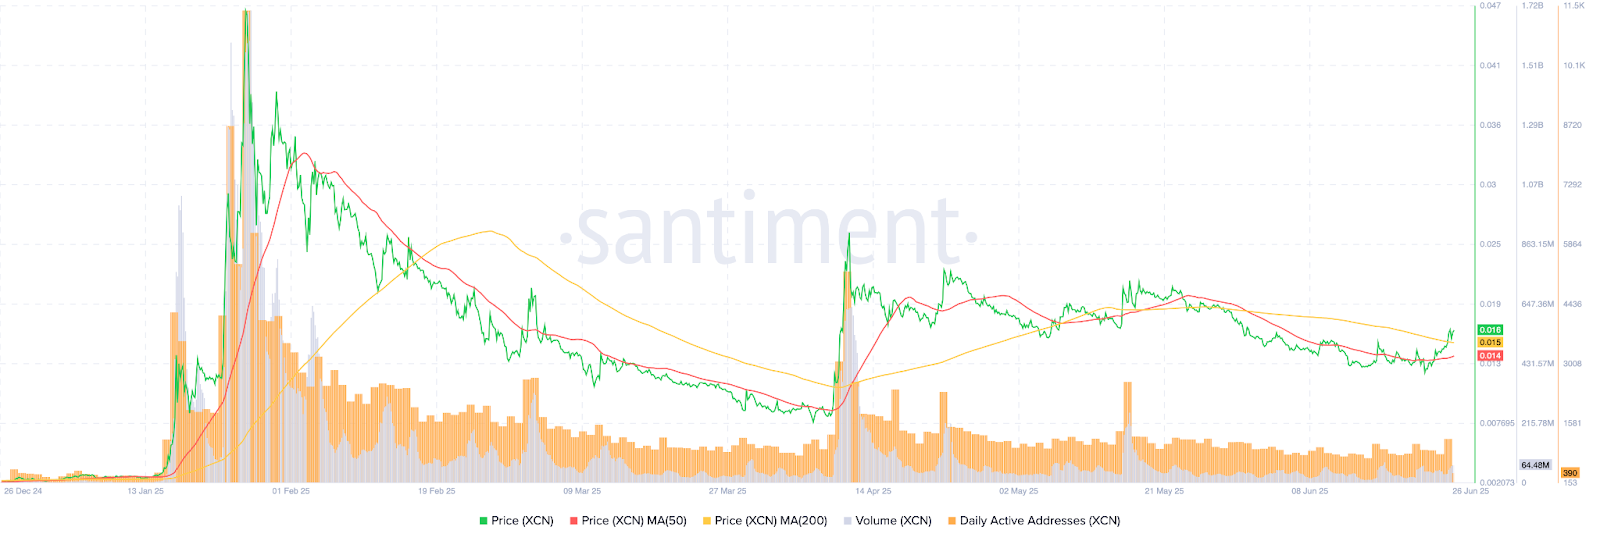
If the buying pressure persists, the next target may lie near the 200-day MA, estimated around $0.0185. Network activity also had a mild boost. Daily active addresses (DAA) have increased to 390, up from earlier June levels.
The volume recovery and DAA uptick present technical signs of a possible short-term reversal. However, resistance at $0.018 remains significant and must be cleared to confirm further upside.
Trend Outlook and Potential Prices
The prices suggest bullish momentum is building, but key levels must be monitored. The psychological barrier at $0.020 is a major hurdle. A failure to break above $0.0175–$0.0180 could lead to a retest of the $0.0145–$0.0150 support area.
A drop below that region could bring $0.013 back into play. XCN’s performance is majorly influenced by the growing volume, renewed address activity, and strong technical indicators. However, resistance levels remain a key test ahead.


