
- Ethereum has broken out of a multi-year symmetrical triangle on the weekly chart, reclaiming multiple key resistance levels with a strong +22.78% move, signaling a potentially sustained uptrend.
- Indicators like RSI and MACD confirm the rally’s strength, with RSI still below overbought levels and a bullish MACD crossover suggesting room for further upside momentum.
- CME Ethereum futures open interest has surged 50%, contrasting with a 30% drop in Bitcoin futures, showing growing institutional preference for Ethereum amid ETF optimism and tokenization trends.
Ethereum has seen its fair share of dramatic price swings, and the recent surge is once again capturing traders’ attention. After spending much of 2022 to 2024 in consolidation, ETH made a strong move upward in early 2025—sparking renewed buzz around price predictions. The hot topic now: could Ethereum be on its way to $4,000? Many low-leverage bulls seem to think so—and they’re placing their bets accordingly.
According to the latest data, Ethereum is now at $3,588.31 with a 1.1% 24-hour increase. The ETH/BTC price has also risen 0.7%, reflecting growing confidence relative to Bitcoin. This is as investors increasingly seek Ethereum ETF products and construct positive sentiment towards regulatory clarity in the US. Interestingly enough, such structural and technical validations signal a breakout that is both supported and maintained by recent market flows.


Ethereum Breaks Out of Multi-Year Triangle, Eyes Bigger Move Above $3,600
According to analyst Sykodelic, Ethereum surged above $3,600 this week, marking a decisive breakout from a multi-year symmetrical triangle pattern. This development has drawn attention across trading desks, especially as the weekly chart shows the asset reclaiming three key technical levels in one swift move.
Notably, the breakout follows a period of price compression within a converging triangle range that dates back to 2021. ETH has now reached $3,647.67 on the 1W timeframe with a 22.78% move, regaining the upper boundary of the triangle pattern after previous deviations above and below it. Market analysts are closely watching for a confirmed weekly close above this structure, which could set the stage for a larger move.
Technical Indicators Confirm Strength Behind ETH’s Move
The validity of the breakout has technical indicators. The weekly RSI on Ethereum is not in a place that indicates overbought conditions, indicating scope to large momentum. On higher timeframes, the RSI is below 70, which shows a healthy rally. This arrangement is also supported by a MACD signal on the hourly chart with positive momentum being maintained despite short-term variations.
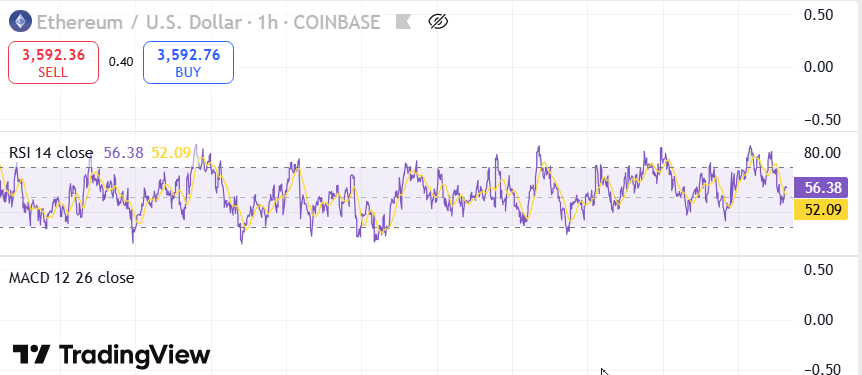
The RSI on the 1-hour chart shows a reading of approximately 54.71, and MACD lines indicate an advanced position, with a bullish crossover that is stable. This suggests underlying strength remains intact in the near term. Market participants are now focusing on $3,669.85 as the immediate resistance level, while support is seen at $3,491.87. This price structure provides a tight range for potential continuation or consolidation, as short-term momentum builds on long-term structure.
CME Futures and Spot Price Align with Breakout Momentum
The surge in Ethereum price also coincides with a broader uptick in derivatives activity. CME Ethereum futures open interest has increased significantly, outpacing Bitcoin futures which saw a 30% drop. This divergence highlights institutional preference shifting toward ETH during this current cycle. On-chain flows and spot price alignment reinforce the directional bias. Bitcoin futures open interest on CME has declined 30% since its peak in Q4. Ethereum, however, has seen a 50% increase in the same metric over the same period.
This uptick indicates an increase in ETH futures positioning by traditional finance entities. Analysts explain the trend by Ethereum incorporating tokenization initiatives and growing Layer-2 infrastructure both fashionable to institutional strategy.
The bull technical indicators, combined with literally exploding institutional demand, and the long-awaited breakout of an Ethereum multi-year triangle, are significant events in the 2025 outlook. As the ETH/BTC ratio increases and the CME futures gain traction, the price of Ethereum appears to have growing momentum ahead-of-schedule speculation suggesting an advance to the $4,000 price targets.


