
- TRUMP’s breakout from a falling wedge suggests bullish momentum, with key resistance at $30.40, $41.31, and $51.44.
- Volume surged to 280.12K, confirming strong buying pressure. RSI at 68.84 suggests a possible short term pullback before more gains.
- Sustaining above $21 could push TRUMP to $25-$30, but an overbought RSI may lead to a pullback toward $19-$20 before further upside.
The TRUMP token has surged substantially, up from $15 to $21 within a short period. The price movement shows strong bullish momentum, with higher highs and higher lows. Analyst Rose noted that TRUMP rebounded from the accumulation zone after forming a falling wedge pattern. This breakout suggests strong buying pressure, potentially pushing the price toward key resistance levels.
Bullish Momentum and Key Price Levels
TRUMP has broken out from a falling wedge, a pattern often associated with trend reversals. The downtrend saw lower highs and lower lows, but the breakout indicates a possible shift toward an uptrend.


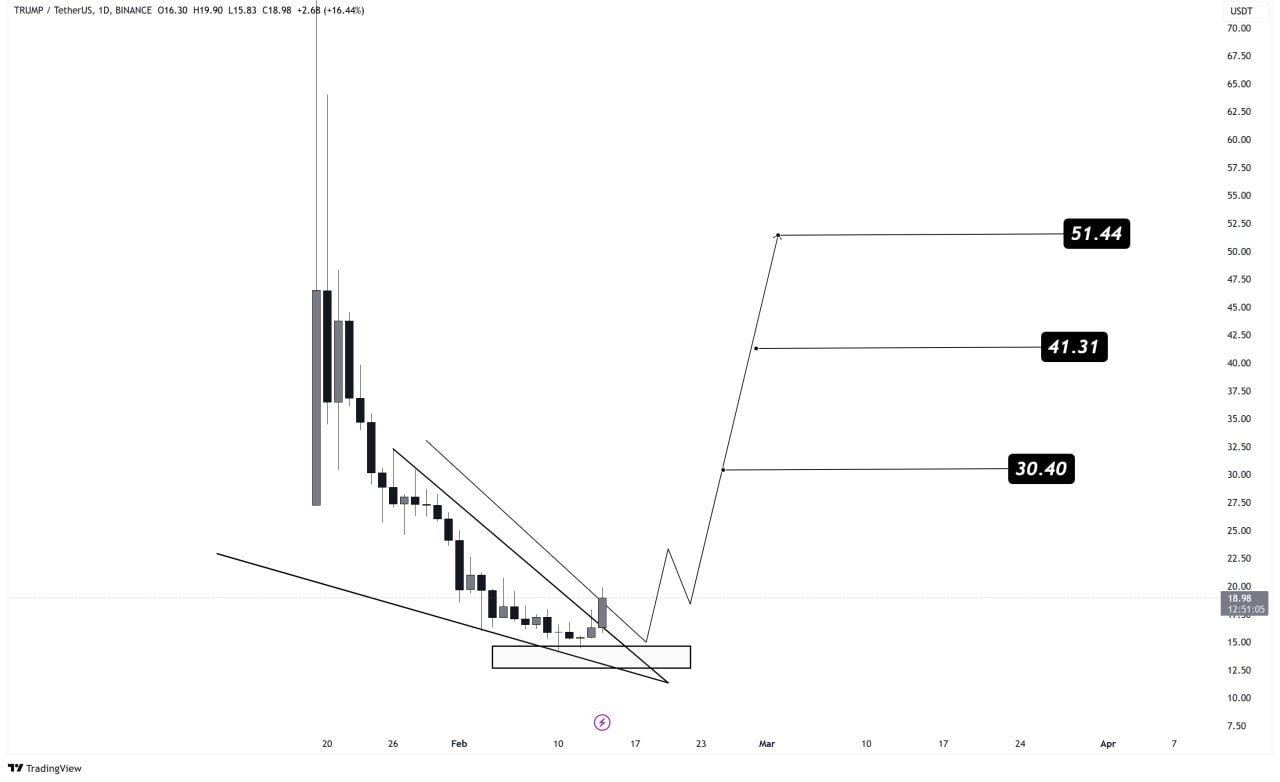
TRUMP has support at the bottom of the wedge before rebounding. The key resistance targets are $30.40, $41.31, and $51.44. The first level at $30.40 is an important take profit zone, while $41.31 becomes possible if the price holds above $30.40. The final target at $51.44 would be a full recovery of previous losses.
Technical Indicators and Market Reactions
On February 5, TRUMP was trading at $21.06, a 22.40% gain in 24 hours and a 24.54% rise over the past month. The market cap reached $4.21 billion, indicating increased investor interest.
The asset price movement is within the $20.88 to $21.16 range in the past day, showing consolidation near a key support level. The $20 to $21 range is an important support zone, with price above this area.
Volume has majorly increased, reaching 280.12K, confirming strong market activity. This volume surge aligns with the bullish breakout, suggesting continued upside potential. The RSI is at 68.84, nearing overbought levels.
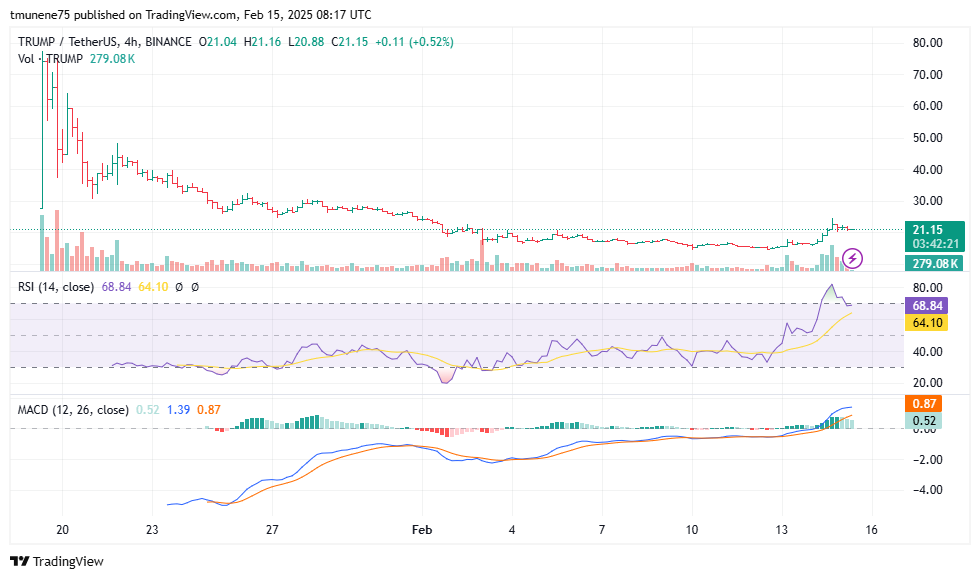
If the RSI crosses 70, a short term pullback may occur before further upward movement. The MACD indicator shows a bullish trend, with the MACD line, at 1.39, above the signal line at 0.87. The increasing green histogram bars confirm growing bullish momentum, supporting buying sentiment.
Potential Scenarios and Price Movements
If TRUMP sustains above $21, the next price targets are $25 and $30. A confirmed breakout past $30 could lead to a mid term rally toward $35-$40.
However, if the RSI goes in overbought levels, a pullback toward $19-$20 could follow before another attempt to break higher. Monitoring volume and price action is essential, as high volatility may lead to sharp movements in an upward or downward movement.


