
- TON struggles at $3.47 resistance but finds strong support near $3.40 level.
- RSI at 54.62 signals rising bullish momentum, hinting at a potential breakout.
- MACD turns positive, indicating growing buying interest and trend shift potential.
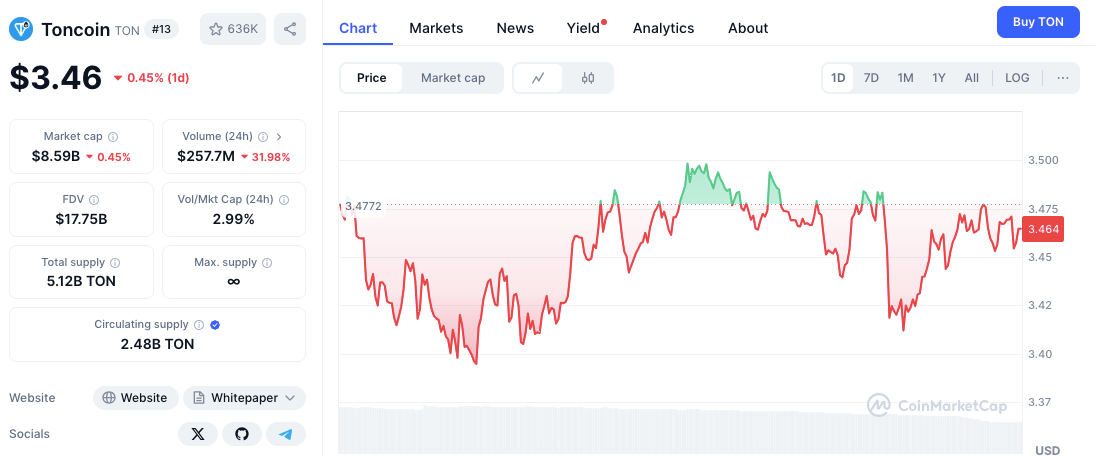
Toncoin (TON) is currently experiencing a period of volatility, with its price at $3.45, reflecting a slight decline of 0.57% over the last 24 hours. Despite this dip, market indicators suggest a potential for both upward and downward movements. Investors are closely monitoring the price action to determine whether TON will break through key resistance levels or fall further due to selling pressure.
Market Trend Analysis
TON has shown significant price swings in recent sessions, reflecting a mix of buying and selling activity. The cryptocurrency briefly touched a peak near $3.4772 before encountering resistance and pulling back. This indicates that sellers are active at higher levels, making it challenging for TON to sustain a rally.


On the other hand, short bursts of buying activity suggest that bullish sentiment is not entirely absent. This tug-of-war between buyers and sellers keeps TON within a defined trading range, making it crucial to watch for breakouts or breakdowns.
Key Support and Resistance Levels
TON’s price structure highlights essential support and resistance zones that traders need to watch. On the downside, the $3.40 level has proven to be a strong support, witnessing multiple rebounds. A breakdown below this level could push the price toward $3.35, where additional buyers might step in. If selling pressure intensifies, TON could test the $3.30 support, which remains a critical floor for the asset. A failure to hold above this could lead to a more substantial decline.
Conversely, resistance at $3.47 to $3.48 remains a hurdle for the bulls. A successful breakout above this range could propel TON toward $3.50, a psychological barrier that could trigger more buying interest. If momentum continues to build, the next target lies at $3.55, where sellers may reemerge to cap the gains. Traders should keep an eye on these levels to gauge market direction.
Technical Indicators and Market Outlook
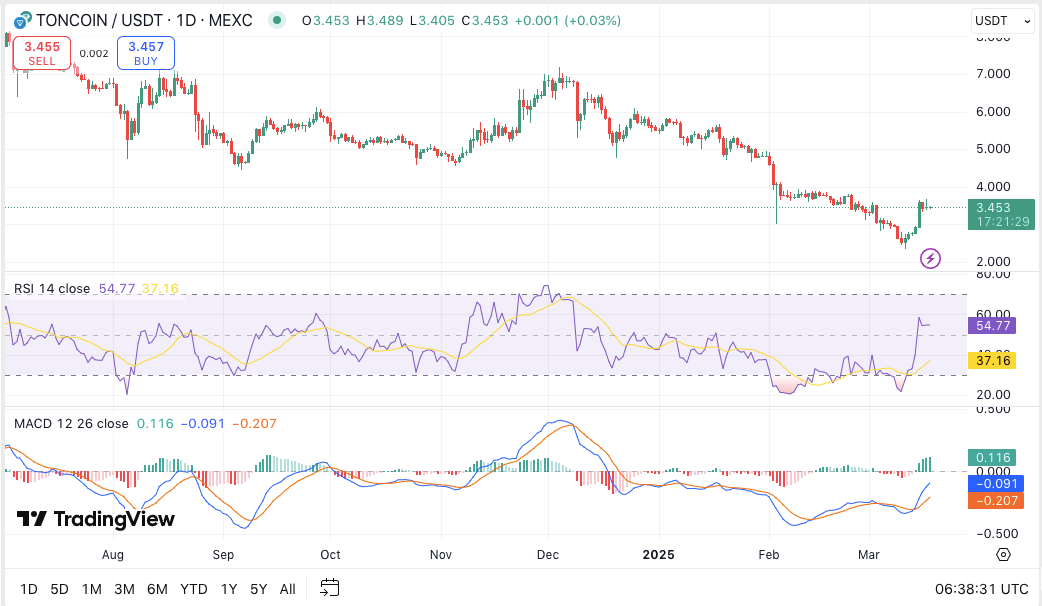
The Relative Strength Index (RSI) currently stands at 54.62, climbing from a previous level of 37.15. This increase signals growing bullish momentum and a potential trend shift. The RSI’s move above the oversold region suggests that TON could continue its recovery if buyers sustain pressure.
Moreover, the Moving Average Convergence Divergence (MACD) indicator has turned positive. The MACD line has crossed above the signal line, signaling increased buying interest. Additionally, the histogram shifting into positive territory further confirms the bullish momentum building in TON’s price action.


