Friday, July 18, 2025
Daily Crypto Post
  • Home
  • News
    • Altcoins News
    • Cryptocurrency News
  • Market
    • Price Analysis
  • About
  • Contact
No Result
View All Result
  • Home
  • News
    • Altcoins News
    • Cryptocurrency News
  • Market
    • Price Analysis
  • About
  • Contact
No Result
View All Result
Daily Crypto Post
No Result
View All Result

SUI Crypto Price Prediction: Will it Reach New Heights on January 14th?

Munene Timothy by Munene Timothy
January 16, 2025
in Market, News
Reading Time: 5 mins read
SUI Crypto Price Prediction Will it Reach New Heights on January 14th
Share on FacebookShare on TwitterShare on RedditShare on Telegram
  • SUI struggles to break $4.60, with RSI at 43.88 suggesting bearish momentum and weak buyer control.
  • Key support at $4.317 aligns with Fibonacci 0.618, while resistance remains at $5.38, indicating consolidation in an upward channel.
  • MACD hints at early bullish momentum, but weak volume at 6.21M suggests uncertainty in market direction.

On January 14th, at press time, SUI was trading at $4.55, a 1.77% increase in the past 24 hours and a 3.92% rise over the past month. Analyst Rose notes that SUI’s current price action is in a consolidation phase and a successful breakout could lead to new targets on a longer term view.

Anchored VWAP and Momentum Indicators

The anchored VWAP provides key resistance at $4.60, with SUI struggling to break this level after a recent retracement. SUI was trading upwards but retraced, now attempting to regain its levels above $4.60. 

Related articles

How Did Circle's Stock Jump From $31 to $299 in Just Weeks

How Did Circle’s Stock Jump From $31 to $299 in Just Weeks?

July 17, 2025
PEPE Eyes Breakout as ETH-Linked Momentum Builds What Are the Next Price Levels

PEPE Eyes Breakout as ETH-Linked Momentum Builds: What Are the Next Price Levels?

July 17, 2025
Source: TradingView

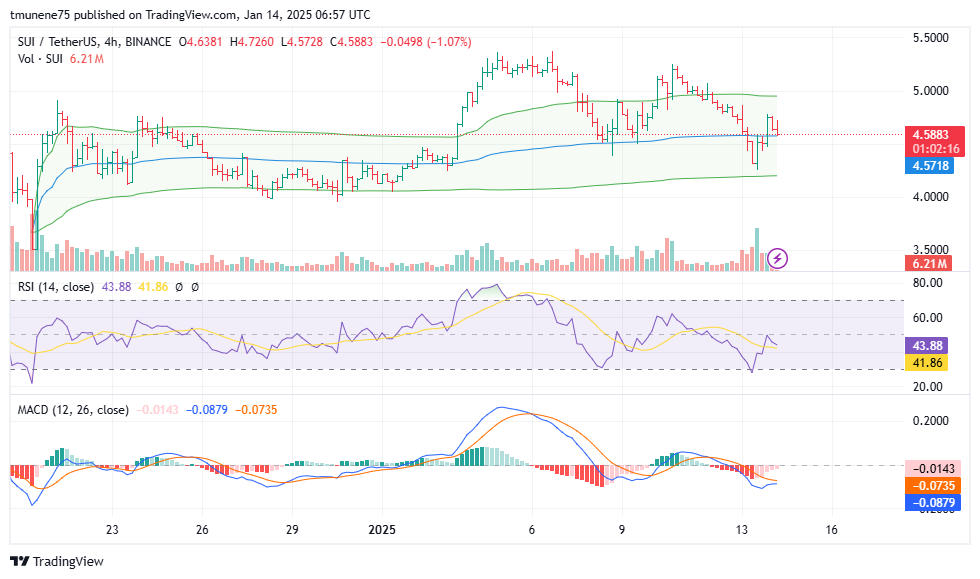
Failure to do so may result in further downward movement. The RSI is at 43.88, indicating weak momentum and a bearish bias, as it fails to break above the 50 mark, showing the underlying selling pressure. 

Additionally, the MACD shows a slight bullish crossover, with the MACD line at -0.0143 crossing above the signal line at -0.0735. However, this early bullish sign lacks confirmation due to weak histogram growth and minimal bullish momentum.

Volume and Key Levels

The trading volume at 6.21M remains moderate, suggesting neither buyers nor sellers are taking control. A substantial change in volume could confirm the next move, whether bullish or bearish. 

If SUI stays below the anchored VWAP at $4.60, a retest of support at $4.57 is likely, with further declines potentially targeting $4.50 or lower. On the other hand, a reclaim of the anchored VWAP, along with increased buying pressure, could push the price toward $4.75 and possibly retest resistance near $5.00.

Moving Averages 

The long term trend is supported by the moving averages. The MA50 remains above the MA200, confirming a bullish trend. A “golden cross” was observed earlier, with the MA50 crossing above the MA200, indicating the start of sustained upward movement. 

Source: Santiment

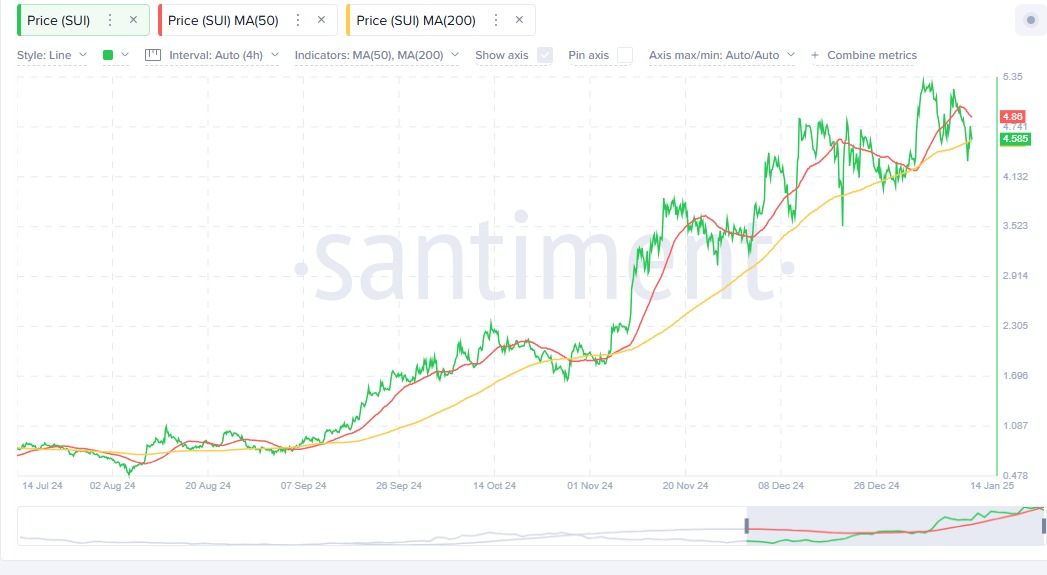
The price consistently bounced off the MA50 during the rally, confirming it as a short term support level. However, the price  has a slight dip below the MA50, hinting at potential weakening of short term momentum. The price has stayed above the MA200, affirming strong long term bullish sentiment. 

Analyst Longer Term View

According to Rose, SUI’s longer term view shows consolidation within an ascending channel, with key support near $3.9775. This setup suggests potential for bullish continuation, targeting $5.39 and $6.51 if the pattern holds. 

Source: Rose

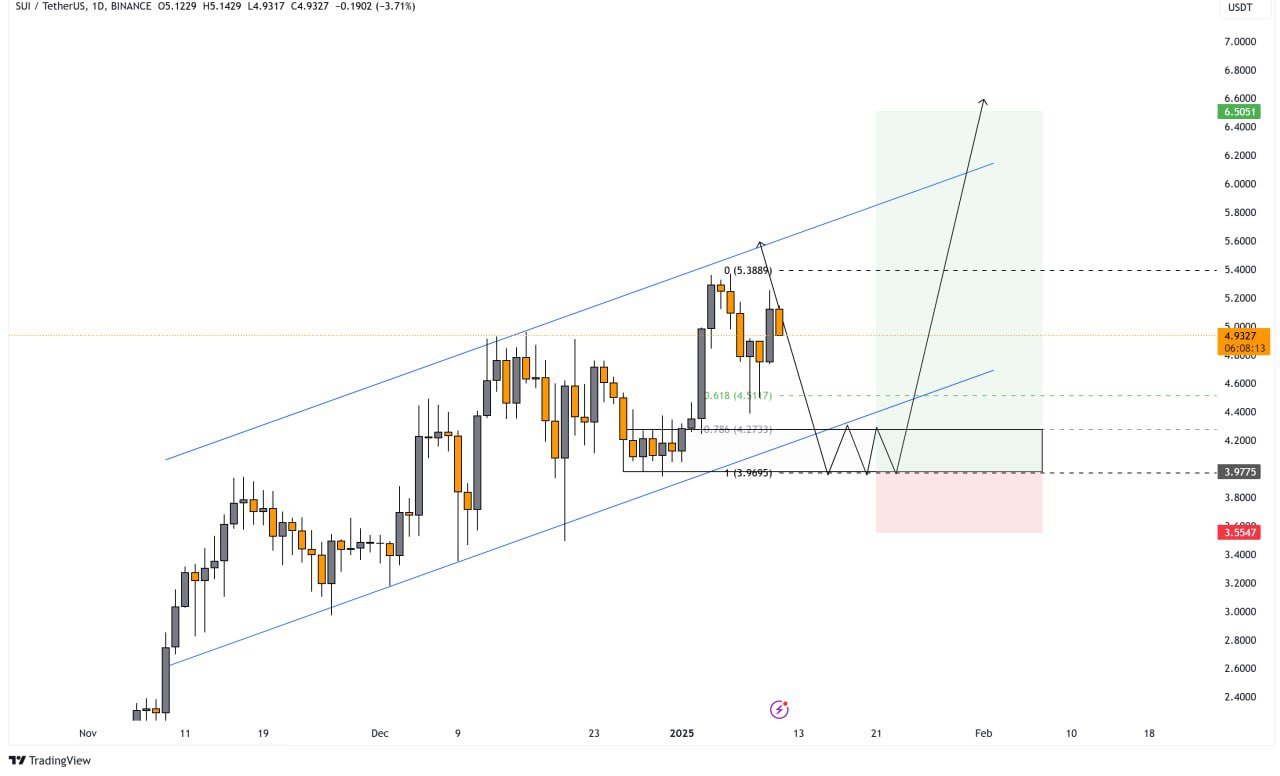
The price is within an upward channel, where the upper boundary acts as resistance and the lower boundary provides support. The recent rejection from the $5.38 high aligns with this channel’s upper resistance.

Fibonacci retracement levels show immediate support at $4.317, corresponding to the 0.618 Fibonacci level. Deeper retracement levels to 0.786 at $3.97 coincide with prior consolidation zones, indicating stronger support. 

Immediate resistance remains at the recent peak of $5.38, while support levels include $4.317, $3.97, and $3.55, aligning with the channel’s lower boundary. The market shows signs of short term profit taking but retains an overall bullish trend, with a potential breakout above $5.38 leading to renewed bullish momentum.

Tags: Altcoin News

Related Posts

How Did Circle's Stock Jump From $31 to $299 in Just Weeks

How Did Circle’s Stock Jump From $31 to $299 in Just Weeks?

by Munene Timothy
July 17, 2025

Circle's IPO surged from $31 to $298.99, lifting its market cap to $72B amid strong demand for USDC and digital...

PEPE Eyes Breakout as ETH-Linked Momentum Builds What Are the Next Price Levels

PEPE Eyes Breakout as ETH-Linked Momentum Builds: What Are the Next Price Levels?

by Munene Timothy
July 17, 2025

PEPE nears 0.00001400 resistance after a 38% rally, with bullish EMAs and a textbook cup-and-handle formation. MACD and RSI indicators...

Bitcoin Dominance Falls Below 63% as Ethereum Rises and Altcoins Rally Across the Market

Bitcoin Dominance Falls Below 63% as Ethereum Rises and Altcoins Rally Across the Market

by Veronicah Peninah
July 17, 2025

BTC’s market dominance has dropped below 63%, suggesting a shift in capital flow toward Ethereum and altcoins. ETH breaks above...

ADA Price Prediction Is $1.50 Within Reach for ADA

ADA Price Prediction: Is $1.50 Within Reach for ADA?

by Irene Mukiri
July 17, 2025

ADA eyes breakout above key trendline as momentum and volume signal strong rally MACD crossover and RSI near 79 confirm...

TerraClassicUSD (USTC) Gears Up for Potential Breakout, Analysts Eye 450% Upside

TerraClassicUSD (USTC) Gears Up for Potential Breakout, Analysts Eye 450% Upside

by Jonathan Carls
July 17, 2025

USTC forms bullish descending wedge, signaling potential 450% rally to $0.081 RSI at 64.37 and rising MACD indicate growing bullish...

Load More

Recent News

  • How Did Circle’s Stock Jump From $31 to $299 in Just Weeks?
  • PEPE Eyes Breakout as ETH-Linked Momentum Builds: What Are the Next Price Levels?
  • Bitcoin Dominance Falls Below 63% as Ethereum Rises and Altcoins Rally Across the Market
  • ADA Price Prediction: Is $1.50 Within Reach for ADA?
  • TerraClassicUSD (USTC) Gears Up for Potential Breakout, Analysts Eye 450% Upside

Popular News

  • Solana SOL Has Just Reclaimed $7 Billion in DeFi TVL

    Solana: SOL Has Just Reclaimed $7 Billion in DeFi TVL

    231 shares
    Share 92 Tweet 58
  • Over $33M in Token Unlocks Set to Impact Crypto Markets Amid Escalating Global Tensions

    199 shares
    Share 80 Tweet 50
  • Bitcoin and Ethereum Face Pressure as 2,500 BTC and 80,000 ETH Hit Exchanges Amid Political Fallout

    194 shares
    Share 78 Tweet 49
  • KEKIUS Price Prediction for June 2025: Signs of Weak Momentum and Accumulation Battle

    195 shares
    Share 78 Tweet 49
  • SEC Approves Nasdaq Crypto Index Update to Include SOL, ADA, XLM, and XRP

    195 shares
    Share 78 Tweet 49

Live Crypto News | Bitcoin and Altcoins News & Insights.

Recent News

How Did Circle's Stock Jump From $31 to $299 in Just Weeks
How Did Circle’s Stock Jump From $31 to $299 in Just Weeks?
July 17, 2025
PEPE Eyes Breakout as ETH-Linked Momentum Builds What Are the Next Price Levels
PEPE Eyes Breakout as ETH-Linked Momentum Builds: What Are the Next Price Levels?
July 17, 2025
Bitcoin Dominance Falls Below 63% as Ethereum Rises and Altcoins Rally Across the Market
July 17, 2025

© Daily Crypto Post. Live Crypto News | Bitcoin and Altcoins News & Insights. All Rights Reserved.

No Result
View All Result
  • Home
  • News
    • Altcoins News
    • Cryptocurrency News
  • Market
    • Price Analysis
  • About
  • Contact