
- Solana faces resistance at $176.50-$177, with $180 as a key psychological barrier.
- RSI near oversold levels suggests potential reversal if buying pressure increases.
- Derivatives data shows lower trading volume but steady open interest in SOL.
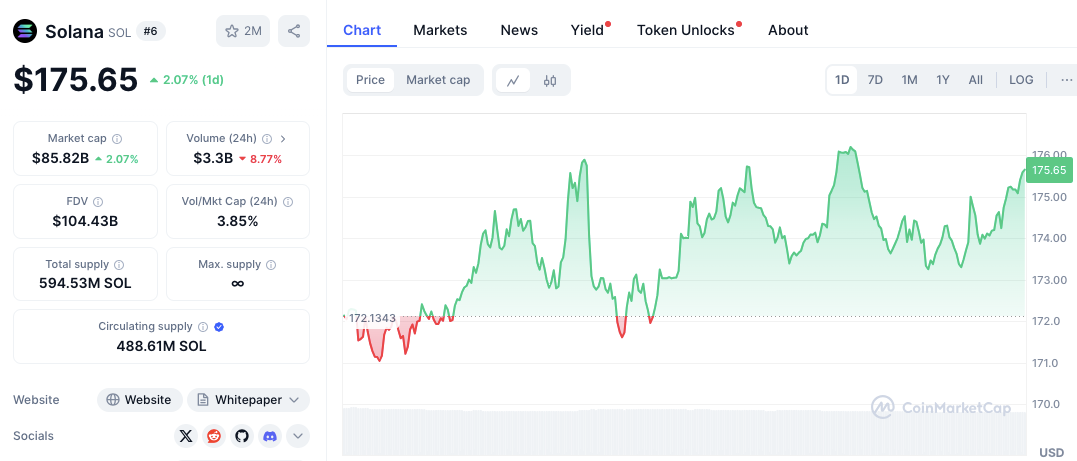
Solana (SOL) is trading at $175.08, marking a 1.60% increase in the past 24 hours. Despite this short-term gain, the cryptocurrency has seen a 10.16% decline over the past week. Its market cap stands at $85.54 billion, while the 24-hour trading volume has dropped 9.04% to $3.29 billion.
These fluctuations suggest a market in transition, with investors watching closely for the next breakout. As February 22 approaches, traders are assessing whether SOL can sustain its bullish momentum or if further corrections are imminent.


Price Trends and Market Performance
Solana’s price has exhibited volatility, initially dipping to $172.35 before rebounding. A strong upward push drove the price above $176, but subsequent corrections prevented further gains.
Despite short-term setbacks, the overall trend remains bullish, characterized by a pattern of higher highs and higher lows. This price action indicates that buyers are still active in the market, though selling pressure at key resistance levels has tempered gains.
Support and Resistance Levels
SOL is currently testing crucial support and resistance zones. The $172.35 level has proven to be a strong support zone where buyers have stepped in. Additionally, the $173.00 level provided brief consolidation before the price resumed its upward movement. If SOL maintains its position above these levels, the bullish trend could remain intact.
On the resistance side, the $176.50 to $177.00 range has emerged as a key hurdle. Sellers have applied pressure at these levels, making it difficult for the price to break higher. Furthermore, the $180.00 mark serves as a psychological barrier. If SOL pushes past this level, it could trigger a renewed rally toward higher price targets.
Technical Indicators and Market Outlook
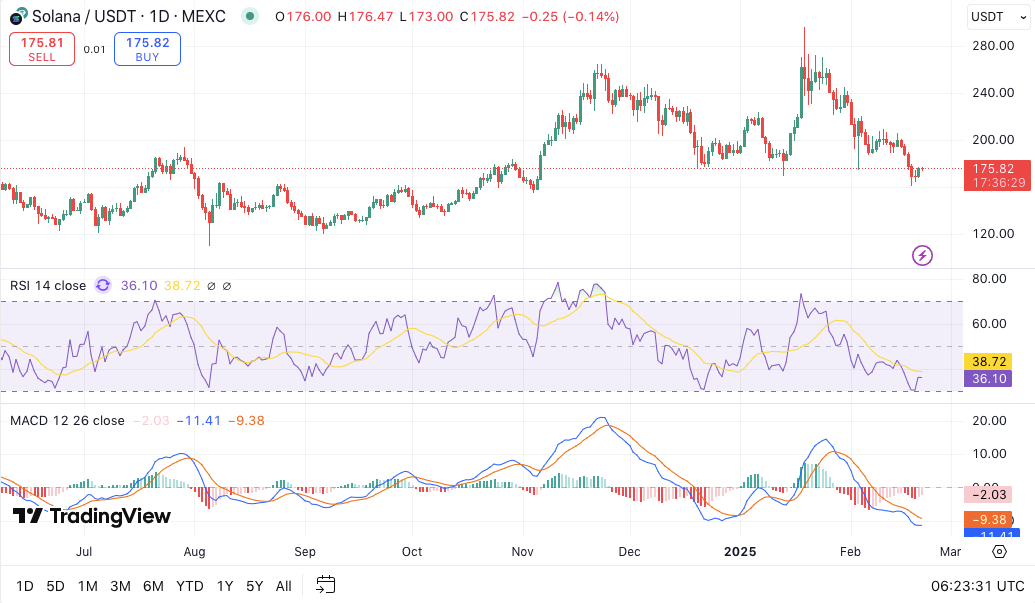
The Relative Strength Index (RSI) is currently at 35.86, suggesting that SOL is approaching oversold conditions. If the RSI falls below 30, it could signal a potential reversal, attracting more buyers.
However, the MACD (Moving Average Convergence Divergence) indicator remains bearish, with the MACD line below the signal line. The negative histogram further supports the presence of selling pressure.
Coinglass derivatives data indicates a decline in SOL’s futures trading volume, which has dropped by 24.76% to $6.98 billion. However, open interest has increased by 1.33% to $5.56 billion, reflecting continued market engagement.
Additionally, options trading volume has decreased by 14.80%, but open interest has seen a marginal rise of 0.16%. These trends suggest that while trading activity has slowed, market participants remain invested in SOL’s next move.


