
- Solana’s price action depends on whether the parallel channel holds or breaks.
- A break below $200 could push Solana toward key support at $150.
- Bearish indicators, including RSI and MACD, suggest short-term downside risk.
Solana’s (SOL) price is currently at a crossroads. The cryptocurrency has been trading within a defined parallel channel, making its next move critical for traders.
Crypto analyst Ali has raised the stakes by identifying two possible outcomes: a sharp drop to $150 or a bullish surge to $350. As the price hovers around $202, traders are left questioning which direction SOL will take.


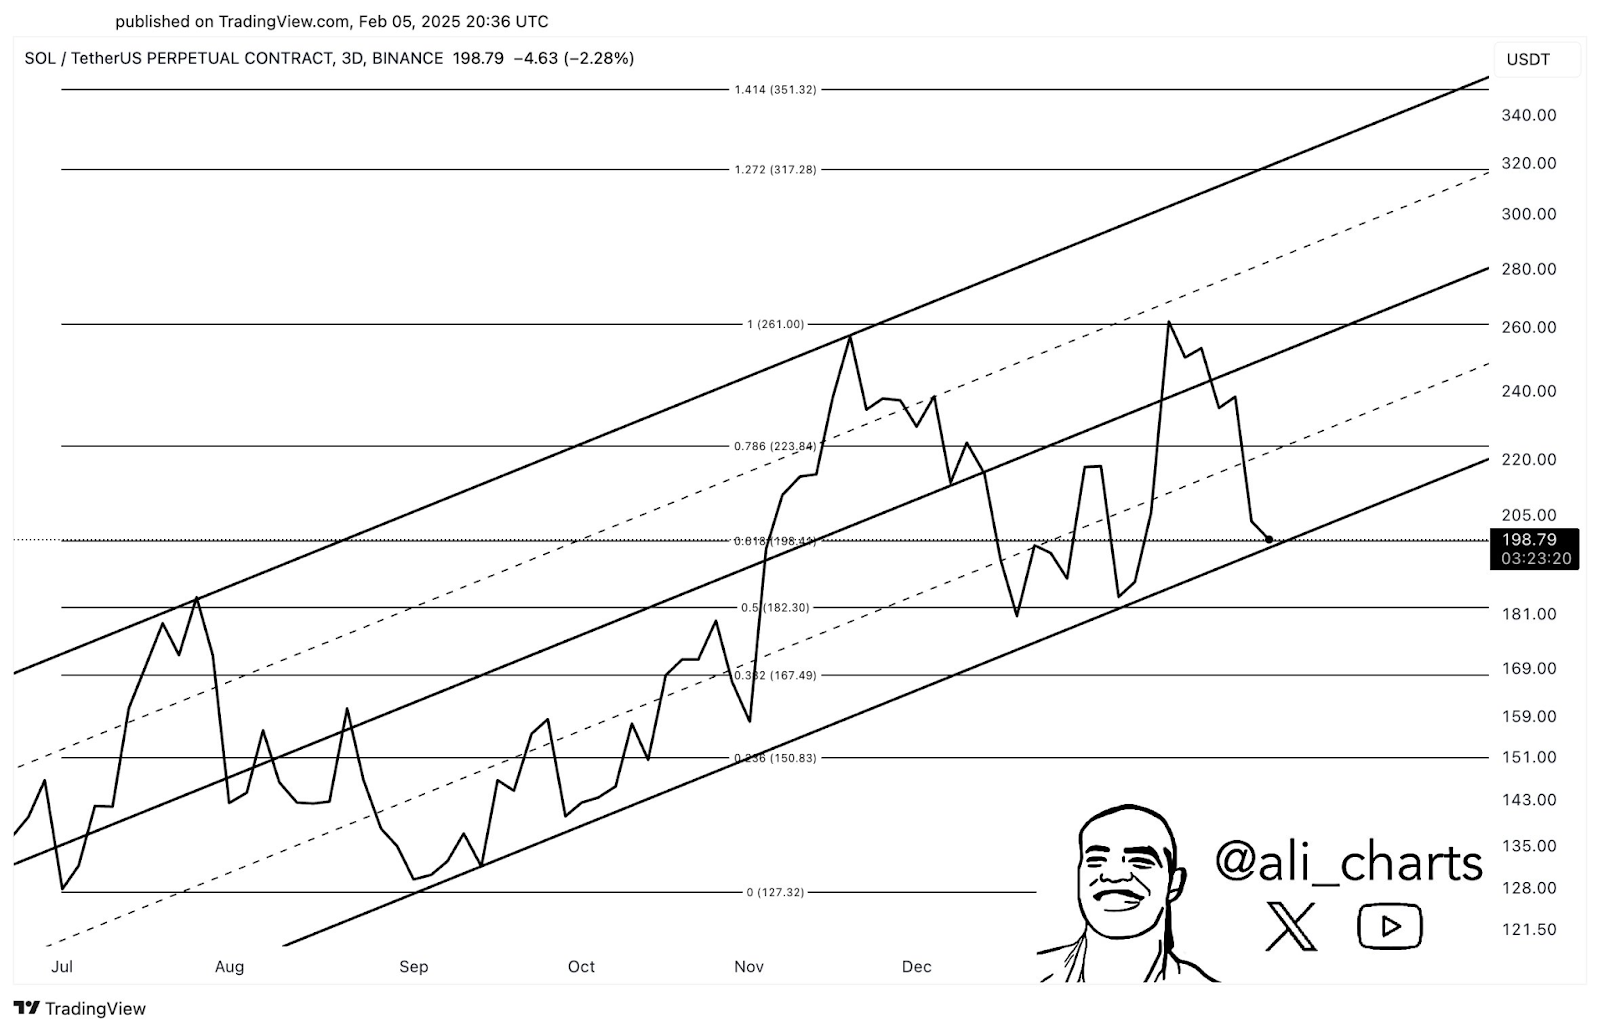
Parallel Channel Holds Key to Price Action
Solana’s price action has been contained within a well-structured parallel channel for some time. According to Ali’s analysis, the channel suggests a clear range of movement with distinct support and resistance levels.
Currently, SOL faces a crucial test. If the channel holds, the price could rise toward the upper resistance level near $350, offering substantial gains for bullish traders. However, if the price breaks down from this formation, it may trigger a significant decline toward $150, where support could hold, at least temporarily.
Key Levels and Market Liquidity Insights
Solana’s current price level of $202 puts it in a delicate position. Recent trading volume has been high, with a 24-hour volume of over $3.7 billion. This suggests that market participants are actively engaging, which is contributing to the heightened volatility.
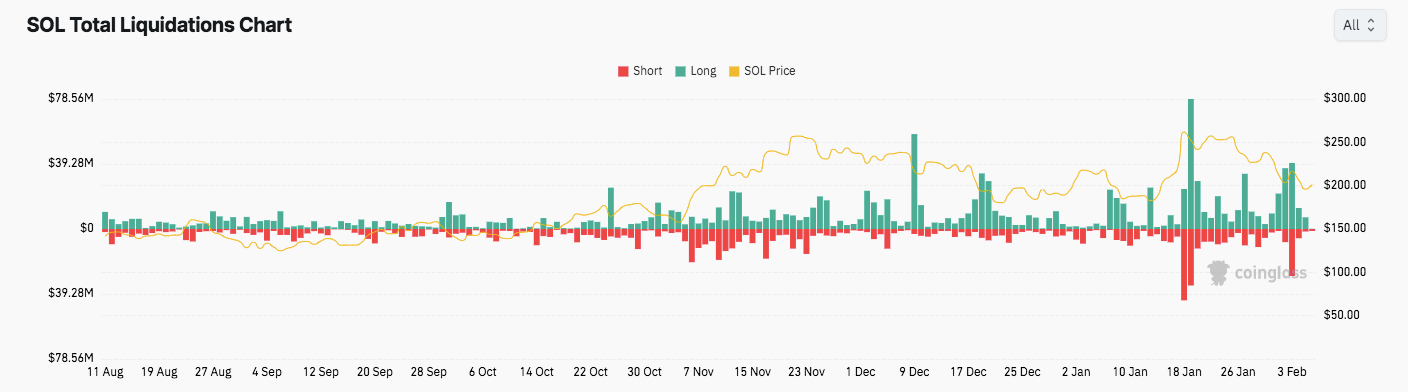
Furthermore, Solana experienced a massive liquidation spike of over $78.56 million in mid-January, primarily due to long position liquidations. This event was followed by another spike in early February, indicating that leveraged traders are facing increasing risks, especially around the $200 level.
Technical Indicators Signal Bearish Momentum
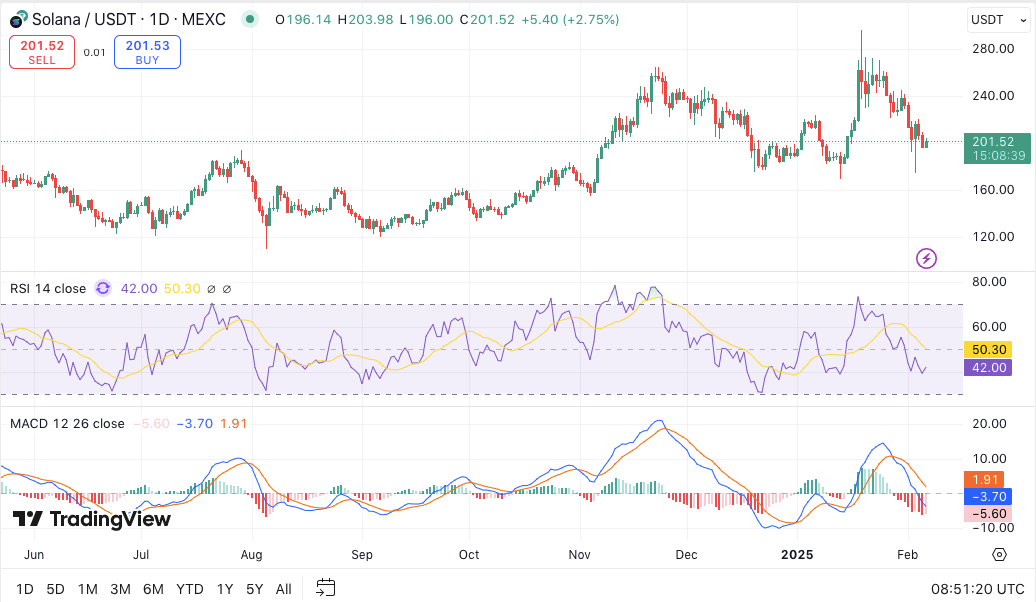
In addition to the channel structure, key technical indicators point to bearish momentum for Solana in the short term. The Relative Strength Index (RSI) is currently at 37.55, which is approaching oversold territory.
While this could suggest a potential reversal or consolidation, the momentum is still weak. The Moving Average Convergence Divergence (MACD) also paints a grim picture. The MACD line is below the signal line, indicating that the bearish pressure may continue unless a reversal occurs.


