
- FIDA continues to slide as selling pressure dominates and technicals remain weak
- RSI and MACD confirm bearish momentum, hinting at further downside for FIDA
- Long-side liquidations persist, showing traders’ vulnerability in a bearish trend
Solana Name Service (FIDA), formerly known as Bonfida, continues to slide through June 2025 as bearish sentiment grips the market. As of press time trading at $0.06825, the token is battling a persistent bearish trend that has eroded investor confidence in recent months. FIDA has dropped nearly 5.85% in the last 24 hours, reflecting consistent selling pressure.
The once promising name service on Solana has seen a significant drop from previous highs, marking a broader sentiment shift in the altcoin market. This downturn is further complicated by declining volume, technical weaknesses, and a history of long-side liquidations that are weighing heavily on its short-term outlook.


Declining Momentum and Key Technical Levels
The current 1-day trend suggests a series of lower highs and lower lows, a classic signal of a downtrend. Starting the day at $0.07332, FIDA slid steadily to $0.0682. This level now acts as a crucial short-term support zone.
If the price breaks below $0.0680, the next levels to watch are $0.0650 and $0.0600. These would mark deeper losses and reinforce the downward pressure.
Resistance lies at $0.0720 to $0.0733, where FIDA previously failed to break through. A rebound attempt will likely meet strong selling interest here. Moreover, the 24-hour volume has dropped by over 66%, reflecting reduced participation and weak conviction among traders.
Indicators Point to Bearish Sentiment

The technical indicators are not offering much hope either. The MACD shows weak bearish momentum with both the MACD and signal lines in negative territory. While the histogram indicates some flattening, there’s no clear sign of a reversal yet.
The RSI sits at 39.57, slightly above the oversold threshold but well below the neutral 50 line. This suggests continued selling pressure, though a bounce could occur if RSI dips below 30. However, such rebounds are often short-lived in a strong downtrend.
Liquidation Patterns Show Long-Side Risk
Long-side traders are facing the brunt of this decline. The liquidation chart highlights a series of long position wipes, with a major peak in December 2024 at nearly $690K. Since then, liquidations have eased but continue to favor longs over shorts. On June 12, 2025, long liquidations totaled $30.36K compared to just $244.81 in shorts.
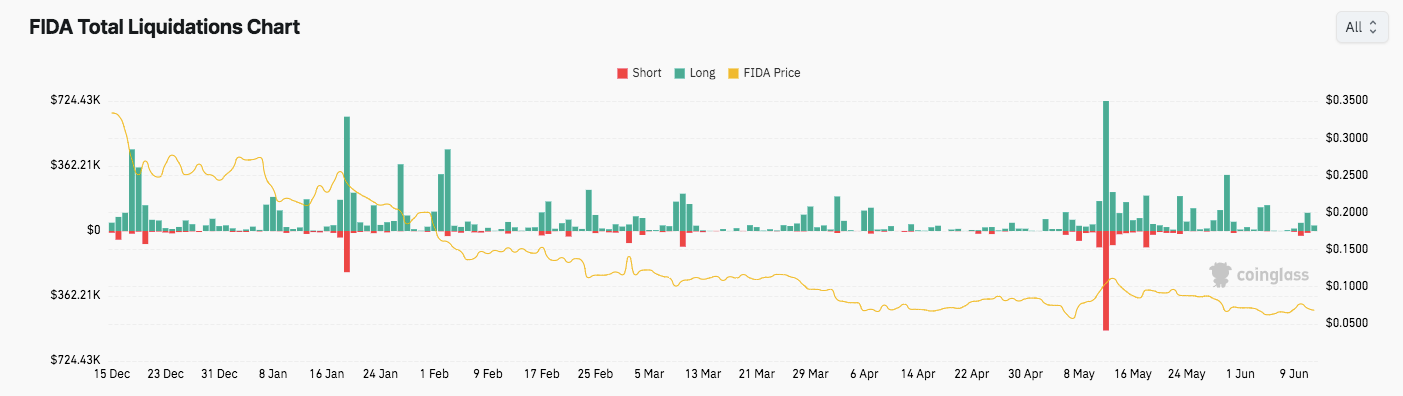
This imbalance shows how vulnerable bullish positions remain. The persistent downtrend from over $0.30 to under $0.10 reflects ongoing structural weakness. Unless broader sentiment shifts, FIDA may continue to struggle in the near term.


