
- SHIB’s price is testing resistance at $0.00001240, with a breakout potentially pushing it toward $0.00001350–$0.00001400.
- The 50-day moving average acts as a dynamic resistance, limiting upside momentum unless SHIB sustains levels above it.
- Bollinger Bands indicate a volatility spike ahead, with key support at $0.00001119 and resistance aligning near $0.00001357.
Shiba Inu (SHIB) has been trading within a descending wedge pattern since late February, forming lower highs and lower lows. According to The Crypto Express, SHIB is consolidating below the wedge’s resistance trendline.
The 50 day moving average is acting as an additional barrier. A breakout above resistance could indicate a bullish shift, while a breakdown below support might invalidate the pattern. The price is currently testing resistance at $0.00001240.


This is a key level that has been limiting an upside movement. Meanwhile, support at $0.00001160 has been tested multiple times, indicating strong buying interest in that range. If SHIB fails to break resistance, further downside movement could follow.
Technical Indicators
SHIB’s descending wedge pattern suggests potential for an upward breakout. The upper boundary of the wedge, around $0.00001240, represents a key resistance level.
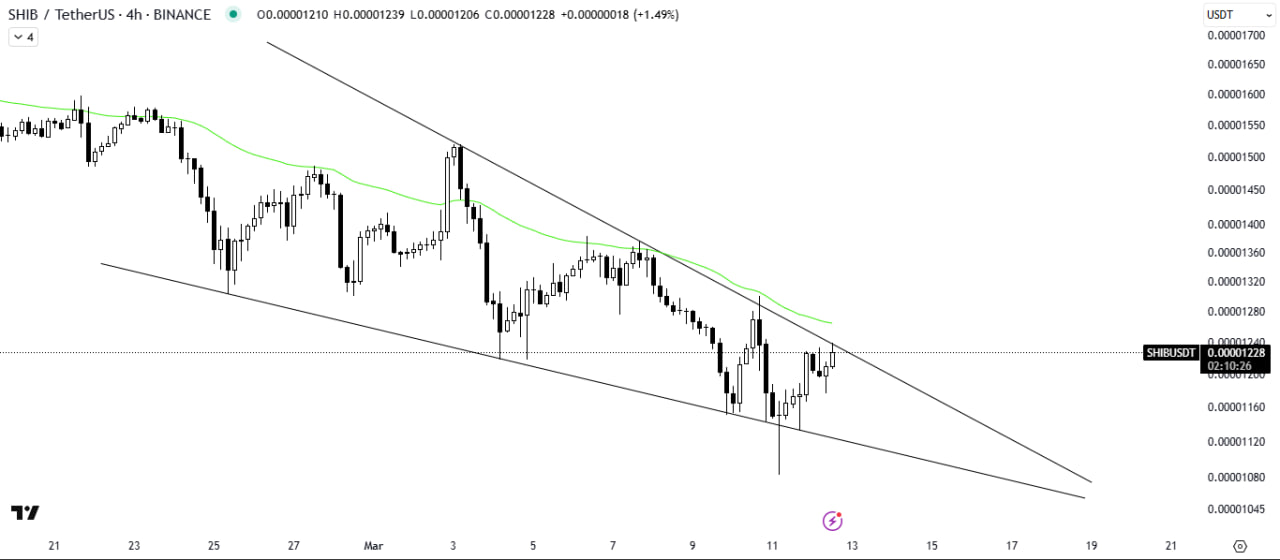
If SHIB breaks above this zone and holds, buying momentum could push the price toward $0.00001350–$0.00001400. The 50 day moving average is the dynamic resistance, preventing SHIB from gaining bullish momentum.
If the price holds above this level, it could confirm a trend reversal. However, rejection at resistance may lead to further downside, with support at $0.00001160 being a critical level to monitor. Bollinger Bands also indicate key price levels for SHIB in the near term.
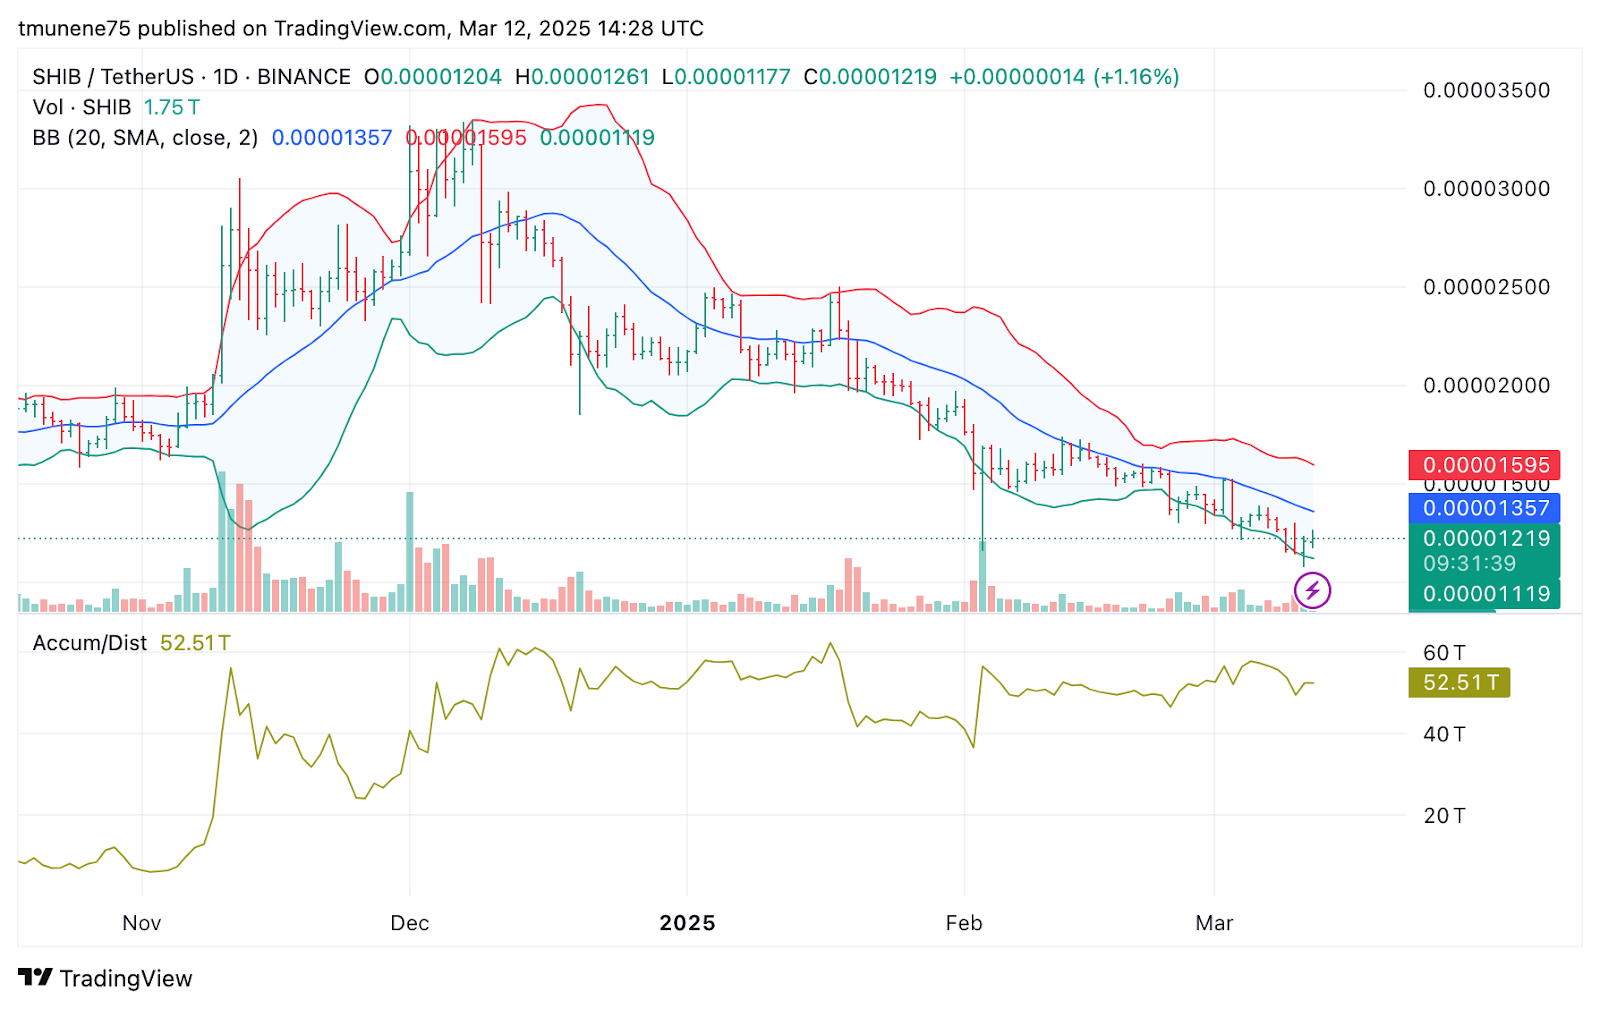
The middle band, which aligns with the 20 day simple moving average, is near $0.00001357 and is a dynamic resistance. The lower Bollinger Band at $0.00001119 has provided support, with SHIB rebounding slightly after testing this level. A squeeze in the Bollinger Bands suggests an imminent volatility spike.
Market Activity and Future Outlook
Trading volume is moderate, with 24 hour volume at 1.75 trillion SHIB. Recent volume spikes near support suggest accumulation by buyers, which may indicate a potential price reversal. The Accumulation/Distribution (A/D) indicator remains in a declining trend.
This is a reflection of the broader bearish sentiment. However, a reversal in A/D could indicate increased accumulation by large investors. If SHIB surpasses $0.00001250 with strong volume, a move toward the next resistance zone at $0.00001600 is likely.
However, failure to maintain levels above $0.00001200 could lead to a retest of $0.00001119 or lower. With technical indicators aligning, monitoring SHIB’s next move is essential to determine its short term price movement.


