
- XRP ETF Decision Looms as SEC Reviews Grayscale’s Proposal Until October 2025
- TD Sequential Buy Signal Hints at XRP Rebound Amid Market Volatility
- XRP Faces Key Resistance at $2.6800, With RSI and MACD Suggesting Bullish Shift
XRP’s price has experienced fluctuations over the past week, giving up recent gains despite positive developments surrounding Grayscale’s ETF filing. The cryptocurrency currently trades at $2.66, reflecting a 1.05% decline in the past 24 hours but maintaining a 3.26% increase over the past seven days.
With a circulating supply of 58 billion XRP, its market capitalization stands at approximately $154.07 billion. Market trends indicate that investor sentiment remains cautious as regulatory factors and technical indicators shape XRP’s next move.


Grayscale’s XRP ETF Filing Under SEC Review
The U.S. Securities and Exchange Commission (SEC) has officially posted Grayscale’s XRP exchange-traded fund (ETF) filing for public review. This marks the beginning of a 240-day evaluation period, during which the SEC will decide whether to approve or reject the proposal. As part of the process, a 21-day public comment period allows stakeholders to provide feedback.
The SEC’s final decision is expected by October 18, 2025. The outcome will largely depend on how the agency assesses XRP’s legal classification and its compliance with securities laws.
Notably, the SEC has historically shown reluctance toward approving altcoin ETFs due to concerns over market manipulation and investor protection. The ongoing legal dispute between Ripple Labs and the SEC remains a critical factor in the ETF’s approval chances. A favorable ruling for Ripple could boost the odds of approval, while regulatory uncertainties may continue to weigh on XRP’s price action.
XRP’s Price Outlook and Technical Analysis
Market indicators suggest a potential shift in XRP’s price direction as technical signals point toward a possible rebound. Analyst Ali Martinez highlighted that the TD Sequential indicator has flashed a buy signal on the hourly chart, hinting at a trend reversal. XRP has been in a downtrend, forming lower lows and lower highs, with the price recently touching $2.6423 before rebounding slightly to $2.6557.
$XRP looks set for a rebound as the TD Sequential indicator flashes a buy signal on the hourly chart! pic.twitter.com/PYN6TuyI8W
— Ali (@ali_charts) February 21, 2025
The immediate support zone is near $2.6400, while resistance lies in the $2.6750–$2.6800 range. A break above this level could trigger further upside, but failure to hold support may lead to a deeper correction. The TD 9 buy signal suggests potential bullish momentum, but confirmation is required before a strong uptrend can be established.
Key Technical Indicators
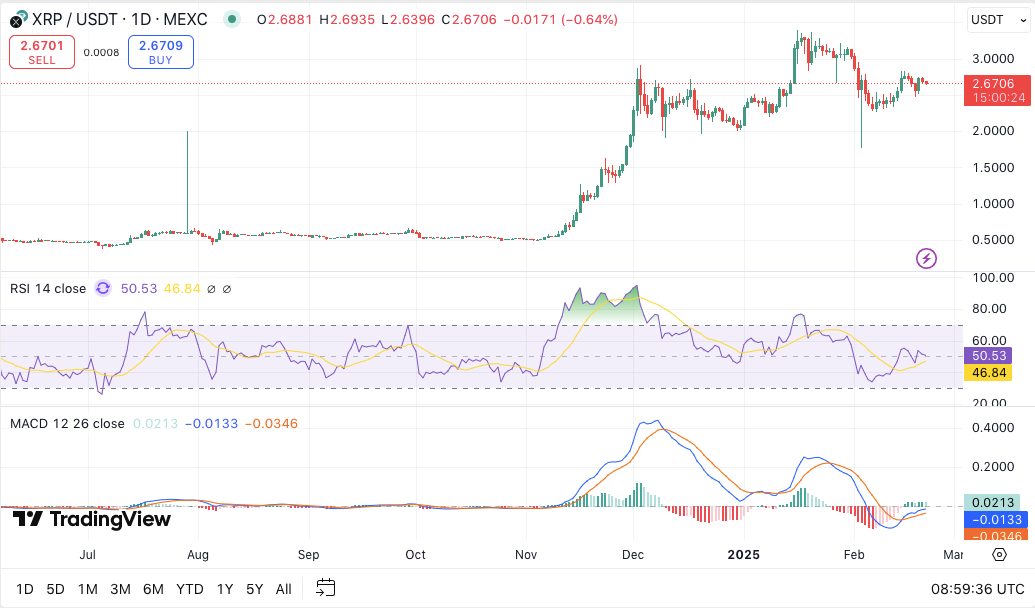
The Relative Strength Index (RSI) currently stands at 50.59, indicating neutral momentum. A move above 60 could confirm bullish strength, while a drop below 40 may signal further downside risk.
Meanwhile, the Moving Average Convergence Divergence (MACD) indicator suggests a potential bullish crossover. If the blue MACD line crosses above the signal line, buying pressure could increase, driving XRP higher.


