
- Ripple’s large XRP moves coincide with its 13th anniversary, sparking market interest.
- Critical liquidity wall below $2.00 could trigger sharp XRP price volatility soon.
- Technical analysis reveals key XRP resistance at $2.41-$2.73 and downside near $1.88.
Ripple has made headlines with a series of high-value XRP movements that coincide with the token’s 13th anniversary. These transfers come as XRP’s market dynamics grow more volatile, with technical analysts warning of a potential sharp price swing.
As the market braces for XRP’s next move, data from exchanges and analysts reveal a crucial price tipping point forming under $2.00. These developments could impact XRP holders and traders significantly in the days ahead.


Ripple Unlocks and Transfers Massive XRP Amounts
To kick off June, Ripple initiated several substantial transactions. According to blockchain tracking service Whale Alert, the company first moved 50 million XRP. This was followed by Ripple locking 670 million XRP in escrow, which is a routine action carried out at the start of each month.
🚨 🚨 🚨 🚨 40,000,000 #XRP (87,344,679 USD) transferred from #Ripple to unknown wallethttps://t.co/NTCW3oKxr9
— Whale Alert (@whale_alert) June 1, 2025
Notably, another 170 million XRP flowed into Ripple from an unknown wallet soon after. The final movement involved a striking 330 million XRP being transferred. These moves have raised eyebrows across the crypto community, especially given their timing with XRP’s 13th birthday.
Arthur Britto, one of Ripple’s co-founders, wrote the original code for XRP on June 2, 2012. That code created the full supply of 100 billion tokens still in circulation today. The combination of Ripple’s transactions and this anniversary has reignited interest in XRP’s long-term roadmap and short-term trading prospects.
Liquidity Wall Below $2.00 Signals Imminent Volatility
Crypto analyst Steph Is Crypto warned of a critical liquidity zone forming just below the $2.00 mark. On June 1, XRP was trading slightly above that level at $2.029. Beneath this price lies a $447.67 billion in leveraged positions, according to Binance’s liquidation heatmap.
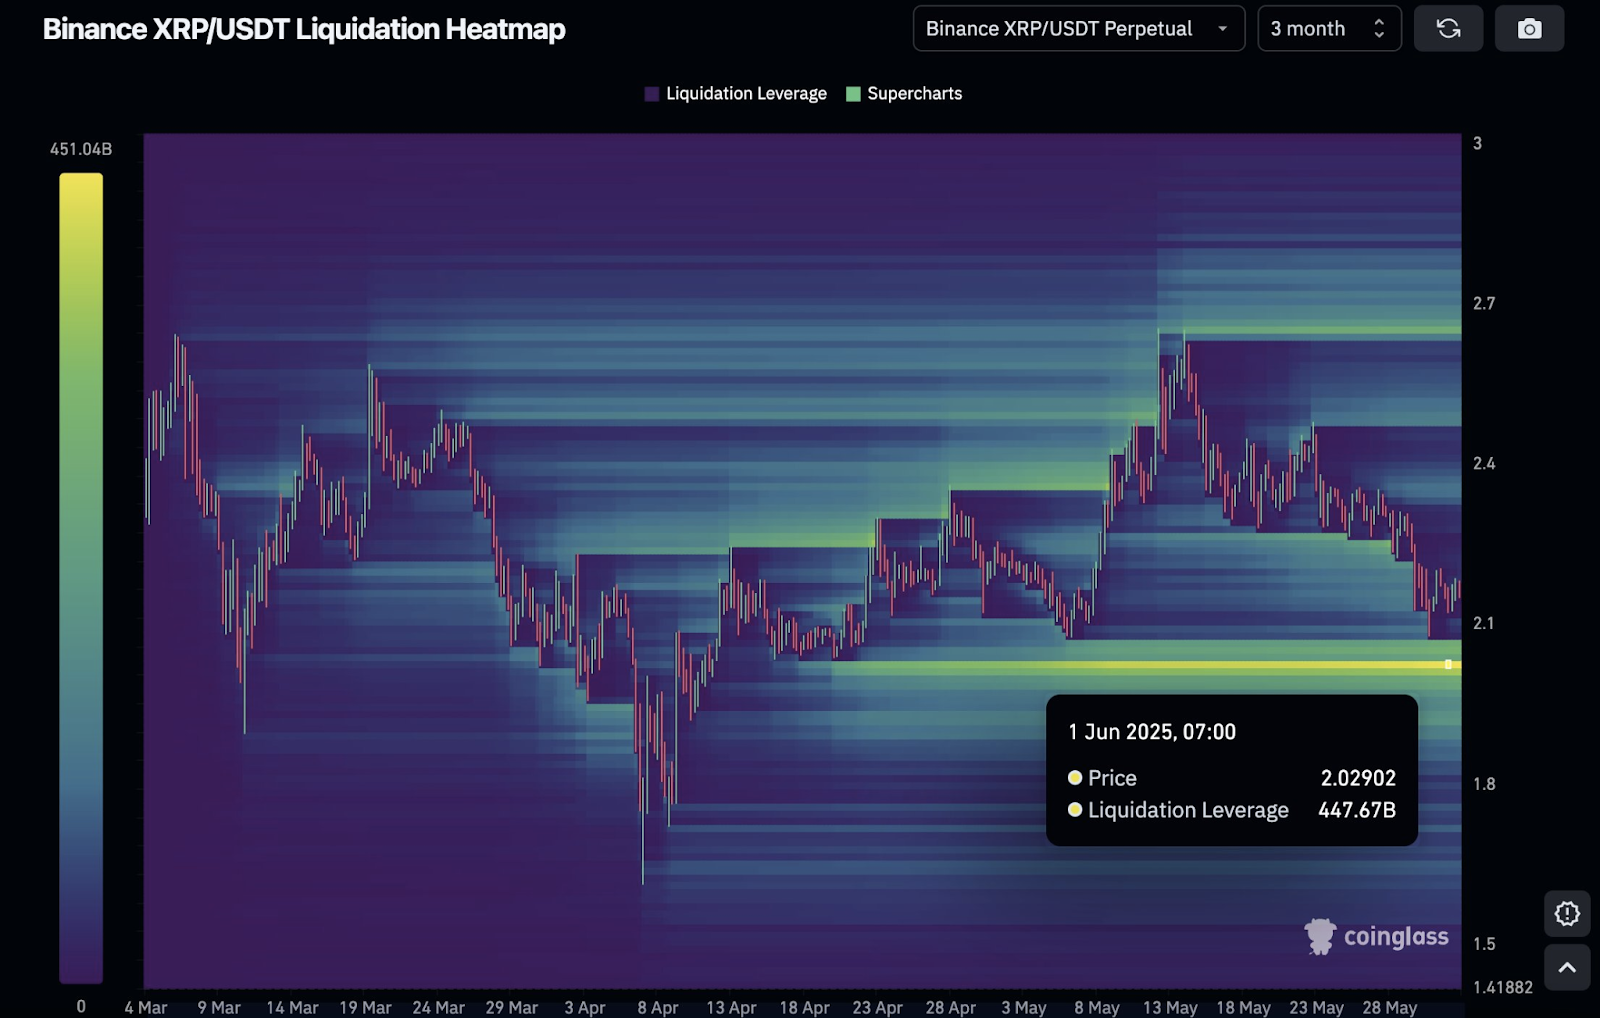
This intense liquidity build-up implies that a drop below $2.00 could trigger a massive sell-off cascade. Consequently, XRP may face aggressive volatility if price levels breach this support zone.
Technical Indicators Reveal Pressure Zones
Market analyst Egrag Crypto shared a detailed breakdown of XRP’s simple moving averages (SMAs). He highlighted five different timeframes that reflect mounting price pressure. On the two-week chart, a dip toward $1.93 appears possible.
#XRP – 21 SMA, 33 SMA, 55 SMA, and 111 SMA:
— EGRAG CRYPTO (@egragcrypto) June 2, 2025
I'll analyze these key simple moving averages (SMAs) across multiple timeframes. This multi-timeframe approach helps us understand the overall trend and better anticipate #XRP’s next moves. 🔍
Here's what to watch:
1⃣ 2 Weeks —… pic.twitter.com/SLqQAYaONm
Meanwhile, the weekly chart shows key resistance zones at $2.41, $2.55, and $2.73. The five-day outlook points to a downside target of $1.88. On the three-day chart, $2.10 holds major significance, while the daily chart currently appears messy with no clear direction.
XRP Market Overview
XRP as of press time trades at $2.17, marking a modest 0.58% increase over the last 24 hours. However, the token has seen a 7.23% decline over the past week. With 59 billion XRP circulating, its total market capitalization now stands at $127.6 billion.


