- RAY price surged to $2.57 after Upbit listing but quickly corrected to $2.26, showing increased volatility.
- Momentum indicators like RSI and MACD suggest a weak recovery, but major resistance holds at the 50-day MA of $2.63.
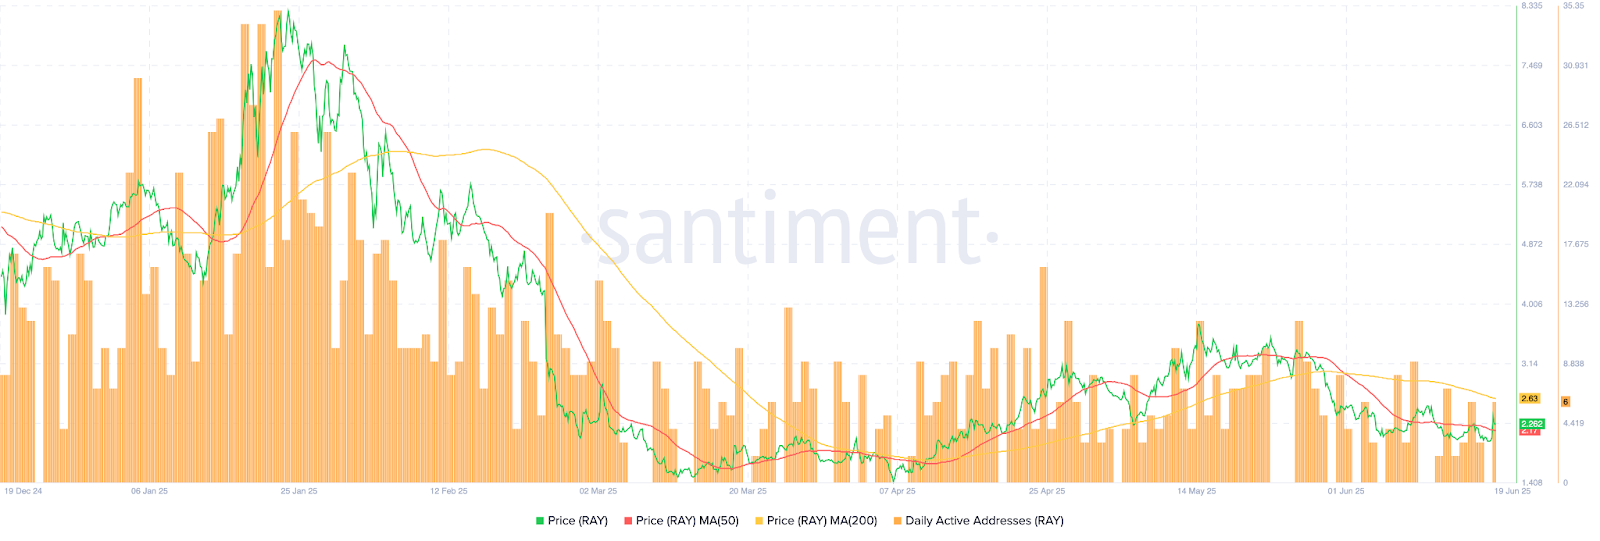
- On-chain activity dropped sharply, with daily active addresses falling from 35 to just 6 since January highs.
RAY, the native token of Raydium, saw sharp price movement on June 19 following its listing announcement on Upbit. According to CoinGecko, the token initially surged by 24.2%, peaking at $2.57. However, it soon corrected to $2.26 after the initial spike.
Despite a weekly gain of 1.38%, the token is down by 28% over the past month. Its market cap has climbed by 10.12% to $603.75 million, with a 24-hour trading volume of $413 million, up 659.46%, indicating increased activity. RAY’s circulating supply is at 267.12 million tokens, while the total supply caps at 555 million.


Momentum Indicators Hint at Recovery Potential
Technical indicators on June 19 show early signs of momentum recovery. The RSI is at 45.23, rising from oversold levels but still below the neutral 50 mark. This suggests moderate buying activity, though not yet a full trend reversal.
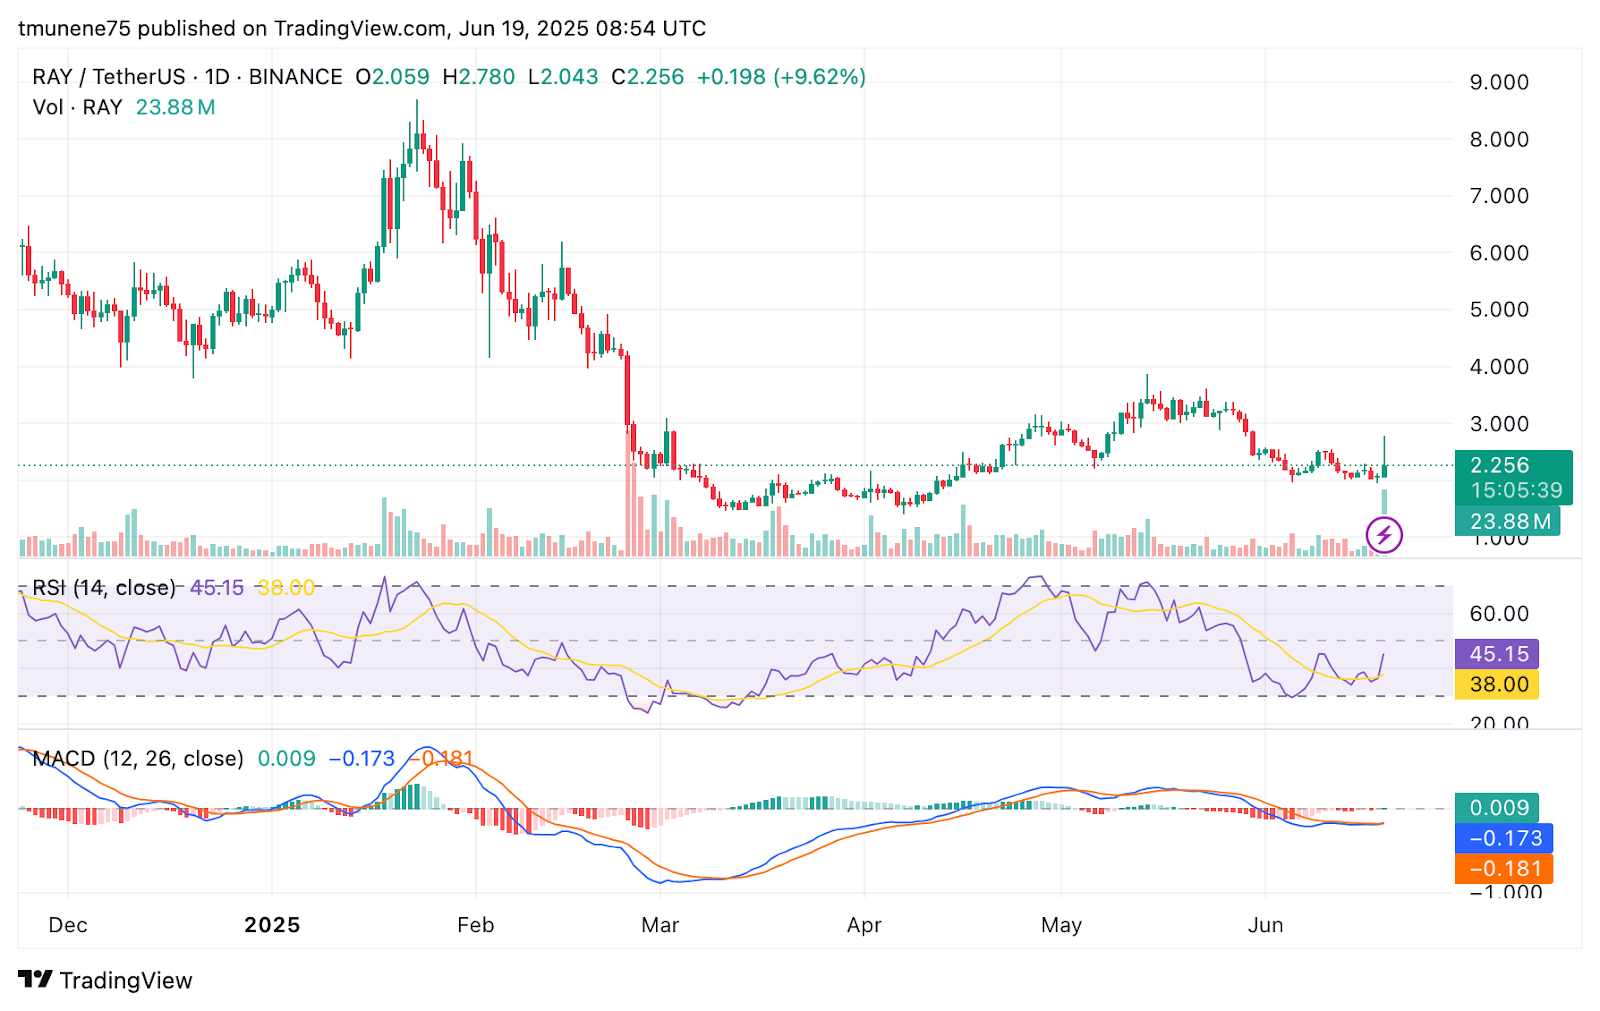
The MACD line has moved slightly above its signal line, now at 0.009, with the histogram turning green. This indicates a possible bullish crossover forming. Meanwhile, recent volatility points to an expansion phase, following a compressed price zone. Bollinger Band behavior supports this directional build-up.
Price Faces Resistance From Moving Averages
RAY’s price trades below both major moving averages, indicating that long-term momentum remains downward. The 50-day MA, now at $2.63, acts as immediate resistance. Price action must breach this level for sustained upside.
The 200-day MA is higher at $3.14, supporting the longer-term bearish outlook. Despite the current recovery effort, the price remains trapped under both trend indicators.
RAY had previously peaked at $8.33 in late January before entering a prolonged downtrend. The current movement toward the 50-day average is a potentially important area.
On-Chain Activity Shows Weakened Network Use
Active addresses have dropped to around 6 per day, down from 35 per day in January. This declining activity suggests diminishing user engagement, which often aligns with weakened price strength.
Notably, RAY’s TVL is at $1.72 billion, with a market cap to TVL ratio of 0.3522. While the TVL remains strong, the significant gap from market cap indicates underperformance in token valuation.
Potential Scenarios for June 20 2025
If buyers push above $2.63, RAY may target $2.85–$3.10 levels, depending on volume strength and increased network activity. Failure to reclaim $2.63 could see RAY slip toward $2.10. If downward pressure increases, the token may retest the $1.85–$2.00 region.
Overall, RAY’s price movement on June 19 shows increased trader interest, supported by volume. However, technical resistance remains overhead. Indicators show early signs of recovery, but network activity remains muted. Momentum around the 50-day MA at $2.63 will likely decide RAY’s direction in the short-term.


