
- Machi Big Brother doubles down on $PUMP despite $10M in realized and paper losses
- $PUMP price plunges 17% in 24 hours as bearish trend shows signs of slowing down
- Technicals hint at potential rebound with RSI near oversold and MACD momentum weakening
Despite facing over $10 million in losses, Machi Big Brother (machibigbrother) is doubling down on his bullish stance on $PUMP. According to Lookonchain data, he continues to add more long positions, even as the token struggles to find its footing.
So far, he’s down $2.17 million on spot holdings and another $8.14 million on perpetual contracts. The persistence of this strategy raises eyebrows as $PUMP remains locked in a clear downtrend. However, technical indicators hint that the bottom may be near offering a glimmer of hope for short-term traders.


Machi Big Brother(@machibigbrother) is still adding more $PUMP long positions.
— Lookonchain (@lookonchain) July 25, 2025
He has lost more than $10M on $PUMP – losing $2.17M on spot and $8.14M on perps.https://t.co/T0DJNDGd53 pic.twitter.com/VJt6SLNzZz
Price Action Points to a Struggling Asset
$PUMP is currently priced at $0.002548, reflecting a sharp 17.07% decline in the last 24 hours. The 1-day chart paints a bearish picture with lower highs and consistent lower lows. The token opened at approximately $0.003066 and dipped to an intraday low near $0.00235.
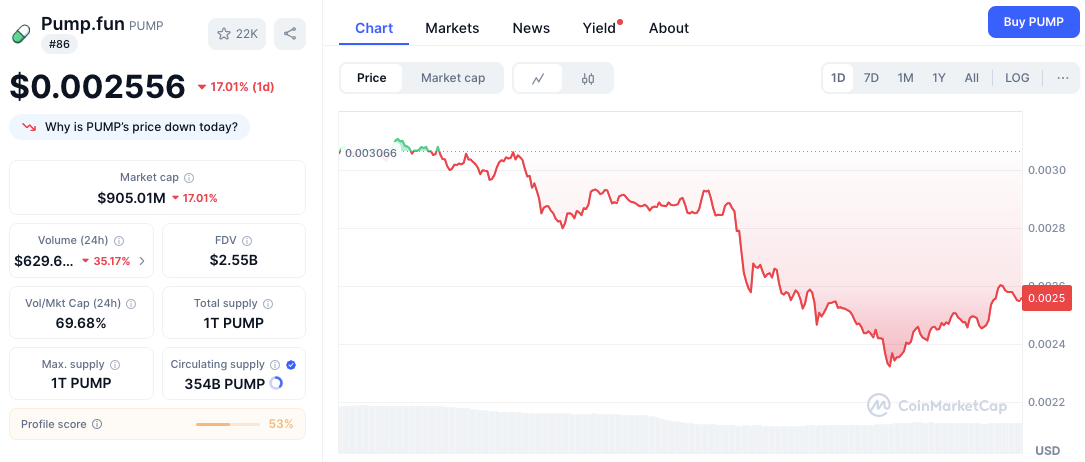
This sharp drop suggests weakening demand, especially as it failed to hold psychological levels like $0.0025. Despite this, there are signs that the decline might be slowing. If support levels hold firm, a short-term rebound could be in play.
Support, Resistance, and Market Behavior
The nearest support zone sits between $0.00235 and $0.00240. These levels are crucial. If they hold, buyers may attempt to regain control. On the flip side, reclaiming resistance at $0.00265 is essential for any sustainable upside. Beyond that, $0.0028 remains a strong ceiling, previously acting as a key inflection point before the latest drop.
Volume is also showing weakness. The 24-hour trading volume fell 35.06% to $629 million, suggesting fading interest among short-term traders. Still, with a volume-to-market cap ratio of 69.32%, speculative activity remains high. This supports the idea that volatility is far from over.
Technical Indicators Suggest Oversold Conditions
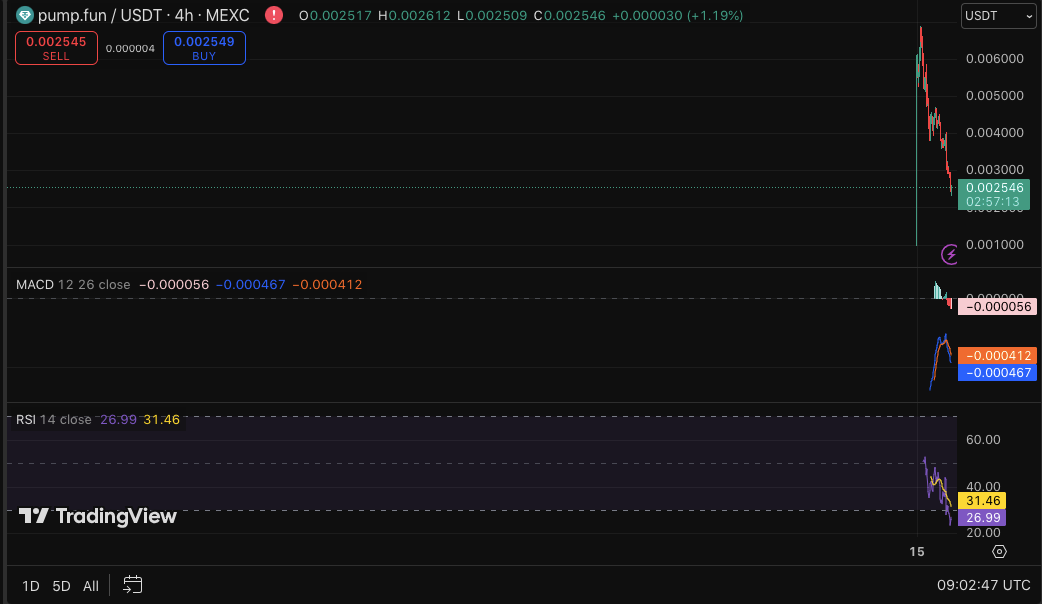
The MACD indicator reveals that the token is still in bearish territory. However, the shrinking histogram suggests bearish momentum may be losing steam.
Additionally, the RSI stands at 31.46, which is just above the oversold threshold. Previously, RSI touched a low of 26.99, and any stabilization here could lead to a technical bounce.


