
- HYPE consolidation between $30–$40 forms key battleground for market direction
- Bearish MACD crossover and RSI cooldown hint at possible near-term consolidation
- Derivatives data shows rising volume and bullish long/short ratios despite pullback
The spotlight has turned to Hyperliquid’s native token, $HYPE, which is showing mixed signals after a strong bullish run. As of press time, priced at $36.56, $HYPE has gained 4.03% in the past 24 hours. However, the weekly chart reveals a 9.90% decline, raising questions about the sustainability of its recent momentum.
Market participants are closely watching the $30–$40 range for clues about its next major move. According to analyst PostyXBT, this consolidation zone is a key battleground between bulls and bears. If the bullish structure is to continue, price should not drop below $30. This makes $35 a critical mid-range support, especially for mid-to-long-term buyers.


$HYPE
— Posty (@PostyXBT) June 24, 2025
Watching the $30-$40 range here.
If bullish structure is to continue, shouldn't see price below $30.
Anything below mid-range at $35 feels like a good mid-long term buy.
Break out above $40 and new ATH likely comes quick. pic.twitter.com/hpXxyse9bf
Price Action and Market Structure
$HYPE has been trending upward, but the rally is pausing within a tight $10 range. Currently, the token is hovering around $36.80, near its mid-range support. This area is acting as a pivot for short-term sentiment. A breakdown below $35 could push the price back to the lower boundary at $30. This level must hold to maintain the bullish trend.
On the flip side, a clean breakout above $40 could trigger price discovery. In that case, a rapid move toward new all-time highs is possible. Hence, $40 acts as a psychological resistance and a potential launchpad. PostyXBT suggests that anything under $35 offers solid entry potential, provided the structure doesn’t break below $30.
Technical Indicators Signal Mixed Sentiment
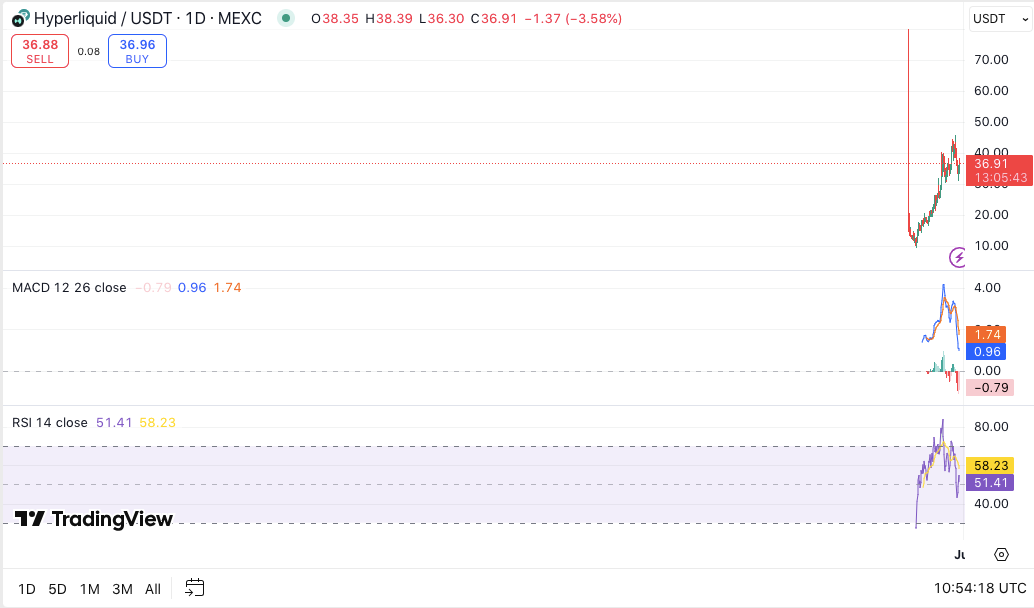
Despite recent price strength, momentum indicators suggest some caution is warranted. The MACD shows a bearish crossover, with the MACD line at 0.94 falling below the signal line at 1.74. The histogram stands at 0.80, indicating slowing upward momentum.
Meanwhile, the RSI has cooled from overbought levels, now sitting at 58.19. Although still above the neutral line, it reflects reduced bullish pressure. These signals hint at a possible short-term consolidation phase before any meaningful move occurs.
Derivatives Data Reflects Bullish Lean
Coinglass derivatives market data shows increased trader activity, with volume rising by 23.17% to $3.27 billion. However, open interest dipped slightly by 1.25%, hinting at cautious positioning. Long/short ratios across major exchanges suggest a mild bullish tilt.
On Binance, the long/short ratio is at 1.1829, while OKX shows a ratio of 1.02. Notably, liquidation data reveals that shorts suffered heavier losses, with $1.39 million wiped out compared to $792K from longs.


