- According to analysts the position of XRP above the Bull Market Support Band (BMSB) indicates possible upward price movements.
- Analyzing the 2017 price movement indicates that a replica of past performance might occur because XRP achieved its 1500% boost while interacting with specific support levels.
- If XRP follows its historical trajectory, projections indicate a rally toward the Fibonacci 1.618 level (~$27) from its current support.
A strong rise in XRP-related market speculation is currently driving the cryptocurrency market.With analysts pointing to historical price movements and key technical indicators, some suggest that XRP may be on the brink of a major rally. Drawing comparisons to the 2017 cycle, when the token experienced an extraordinary 1500% increase within four weeks, traders and investors are watching closely to see if history might repeat itself.
Key Indicator: Bull Market Support Band
According to Egrag Crypto analysis, XRP is currently positioned above the BMSB, which is often interpreted as a positive signal for upward momentum. Also, XRP’s historical performance reveals similarities to the events leading up to its remarkable run in 2017.


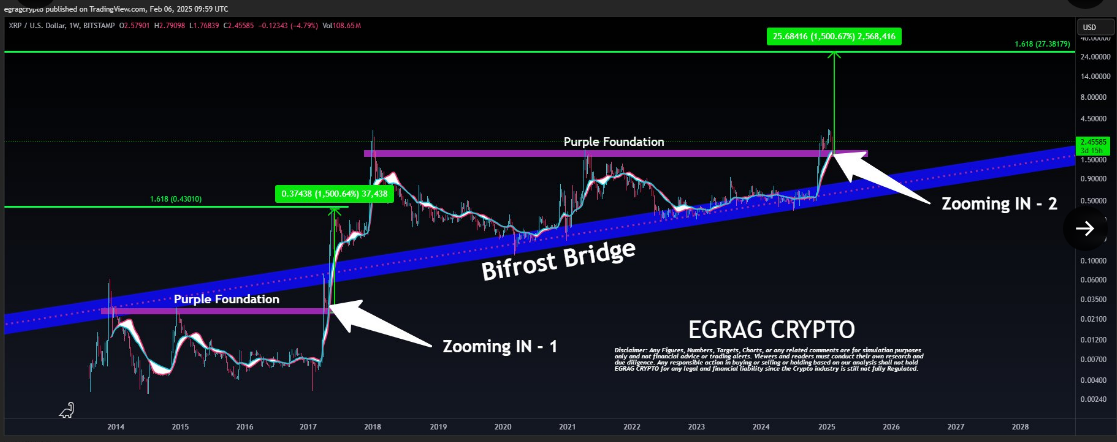
As seen from the chart, the cryptocurrency touched what analysts refer to as the “Purple Foundation” and briefly interacted with the BMSB before skyrocketing in price. The rapid appreciation, which amounted to a 1500% increase, was driven by market sentiment, technical positioning, and broader industry trends at the time.
Current Market Position and Potential Targets
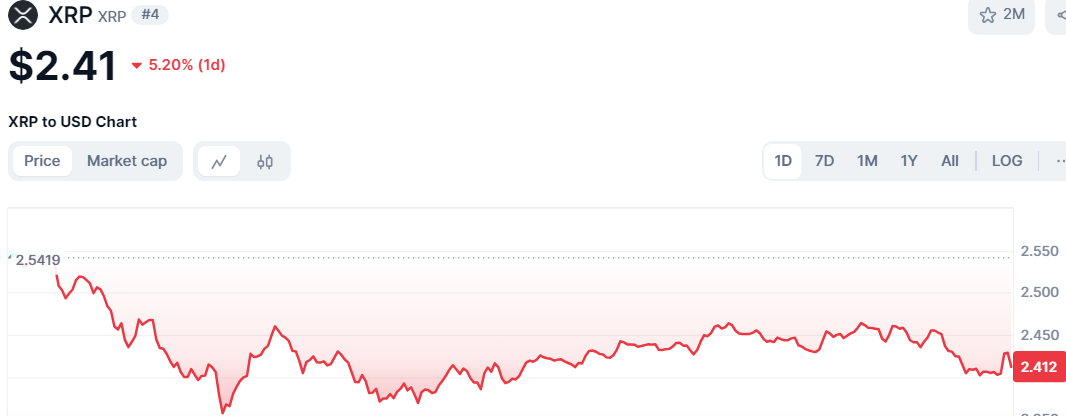
XRP’s price movement has shown notable fluctuations over recent days. Currently, XRP is trading in a bearish momentum with a price decline of 5.3% over the past 24 hours. Despite the dip, trading activity remains strong, with a daily volume of $6.40 billion.
If this pattern continues to hold, projections suggest that XRP could experience another surge of comparable magnitude. Analysts estimate that a 1500% increase from the recent support level of $1.71 could push the price toward the Fibonacci 1.618 level, which is approximately $27.
Historical Patterns: How Pullbacks Set the Stage for Growth
According to analyst Steph Is Crypto,he unfolds XRP’s explosive 110,000% surge in 2017 despite experiencing three major corrections along the way. The early phase of the bull run saw an initial accumulation period, followed by a 24.67% correction, which was a minor dip before the real breakout.
A more extended correction came in mid-2017, where XRP saw a 68.22% decline (-0.27210). This was a prolonged consolidation phase before the market regained strength, demonstrating how deep pullbacks are a natural part of parabolic growth. Finally, as market confidence surged, XRP skyrocketed past $2.50, reaching its all-time high. This pattern highlights how retracements within bull markets serve as fuel rather than signals of exhaustion.
If history repeats, the current market could be preparing for another massive breakout. However, failure to hold key support levels could lead to prolonged accumulation or trend reversals.


