
- FIDA breaks past 50 and 200 day MAs, indicating trend reversal with potential golden cross formation.
- RSI at 67.07 and MACD bullish crossover suggest strong upward momentum near the overbought zone.
- Volume to market cap ratio at 170.51% suggests intense short term trading and rising investor interest.
FIDA, the governance token for Solana Name Service, at the time of writing, FIDA was trading at $0.104, up by 32.26% in the last 24 hours. Weekly gains are at 35.70%, while the token surged by 44.21% over the past month.
Volume surged to $176.89 million, a 558.12% increase in a single day. The market cap is up by 33.46% to $104.19 million. With the entire 990.91 million token supply in circulation, liquidity is high. Volume to market cap ratio is at 170.51%, confirming intense short term trading activity.


FIDA Moves Above Key Averages
Momentum has shifted following the breakout above both the 50-day and 200-day moving averages. FIDA recently surged past the 50 day MA at $0.076, flipping it into support. The 200 day MA at $0.092 is also breached, a move often associated with trend reversals.
A potential golden cross may form if the 50 day average continues to rise above the 200 day. This pattern often coincides with increasing demand.
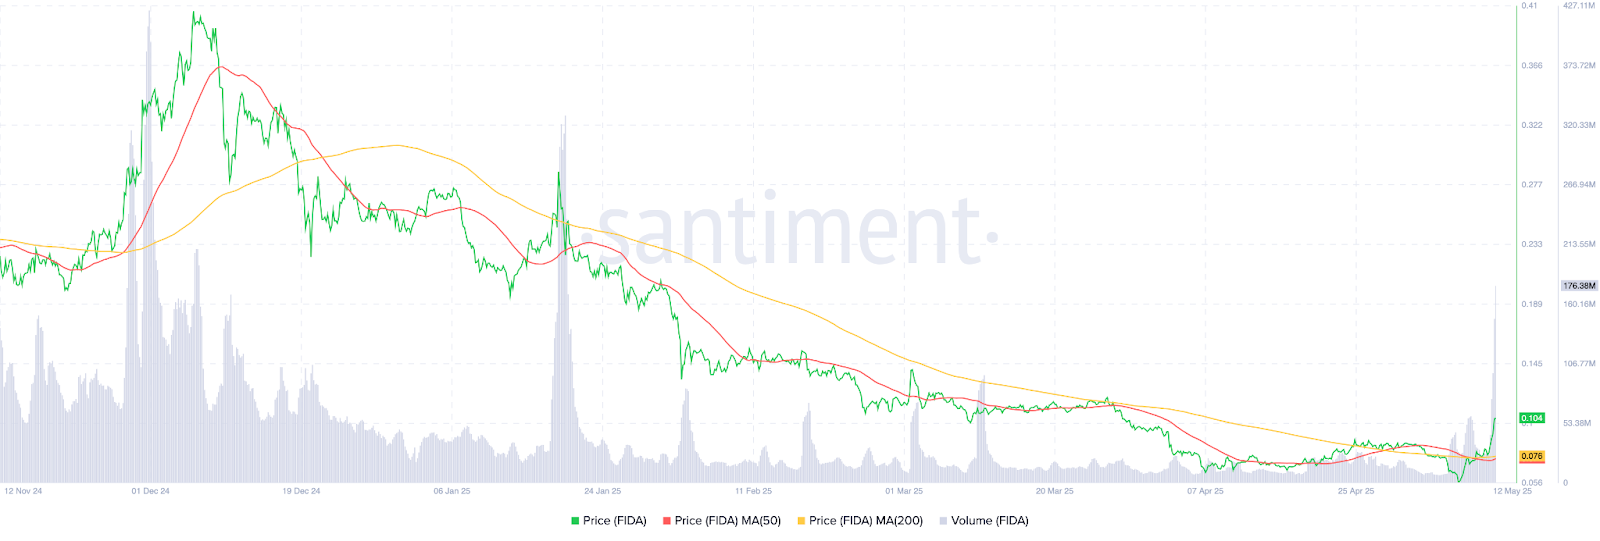
FIDA’s price had remained in a sustained downtrend from December 2024 to early May 2025. However, recent levels suggest a technical shift. Price action now shows a move away from lower highs and lower lows.
Rising RSI and MACD
The RSI is at 67.07, sharply rising from below neutral levels, and nearing the overbought level. The MACD line reached 0.0029, above the signal line at 0.0017, with a histogram of +0.0013. These levels indicate continued upside pressure.
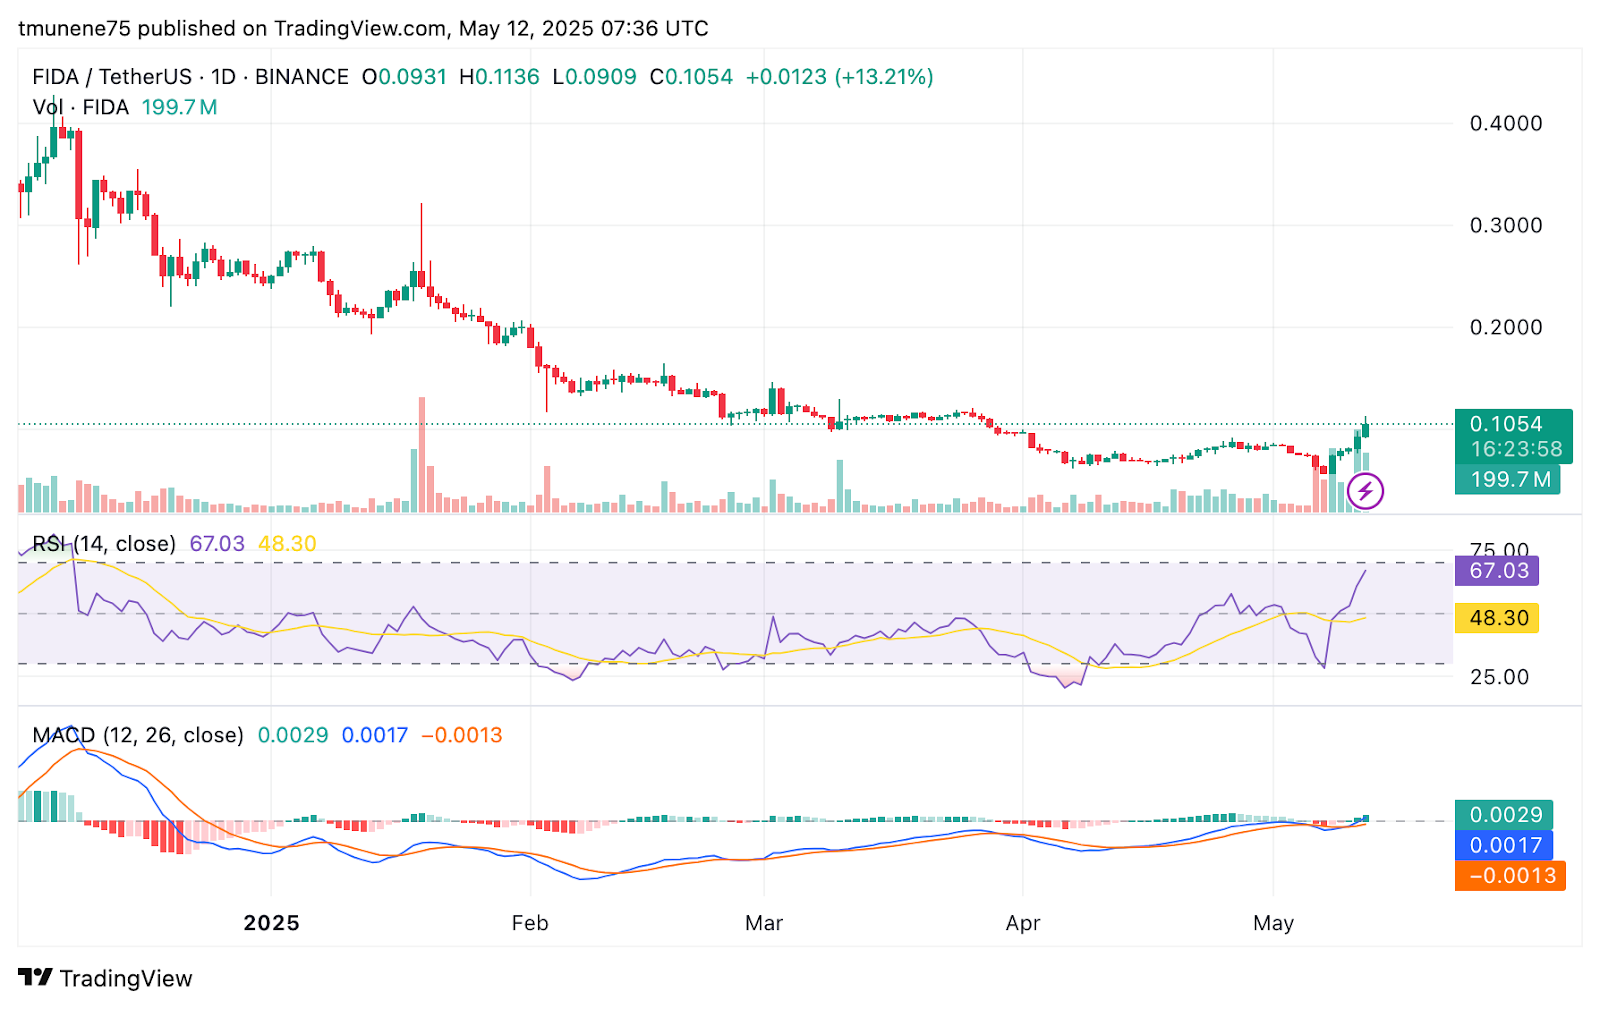
Volume is up to 199.72 million tokens traded in 24 hours, suggesting higher liquidity and active participation. The daily high at $0.1136 now acts as a resistance level. If broken, the next resistance could form around $0.1200 and then $0.1500, a psychological price zone. On the downside, the nearest support is at $0.0900, today’s low, followed by $0.0760.
Volume Surge and Price Movement
Volume levels suggest larger investors may have entered the market. The rise in buy side demand is backed by increased volume at breakout levels. This technical setup aligns with a shift in market behavior around FIDA.
If the price continues holding above both moving averages, confidence may grow further. Sustained volume around current levels remains key for momentum. Observing price behavior near the $0.1136 resistance for further clues could help predict the next price level.
May 13 Price Prediction
On the upside, if momentum continues, FIDA could rise toward $0.1200 to $0.1300, retesting previous resistance from February 2025. However, if resistance holds, a pullback toward $0.0950 to $0.0900 is possible. Below that, $0.0760 may act as stronger support.


