
- Ethereum faces resistance at $2,250; breaking above may target $2,400, while losing $2,155 could lead to declines toward $2,000.
- Solana holds key support at $140; breaking $150 could push to $180, while a fall below $140 may lead to $130 or lower.
- XRP’s resistance is at $2.50; surpassing it may drive prices to $2.75-$2.95, while falling below $2.40 could trigger a drop to $2.20.
The crypto market has rebounded on Wednesday after an initial decline on Tuesday, recovering from losses due to investor caution. The market reacted to President Donald Trump’s proposal for a U.S. strategic crypto reserve taking profits after surges.
This announcement briefly lifted market sentiment before skepticism set in. Despite this, the total crypto market cap has reversed surging by 4.64% to $2.88 trillion, according to CoinMarketCap data. Ethereum rose by 5.58% to $2,196.15, Solana increased by 4.65% to $142.65, and XRP jumped by 4.79% to $2.43.


Ethereum Resistance at $2,250 as Buyers Defend $2,155
Ethereum’s price in the past few days has declined from over $3,600, finding support at $2,155 before rebounding. Key resistance level is now between $2,206 and $2,250. If ETH breaks above this range, it could target $2,400.
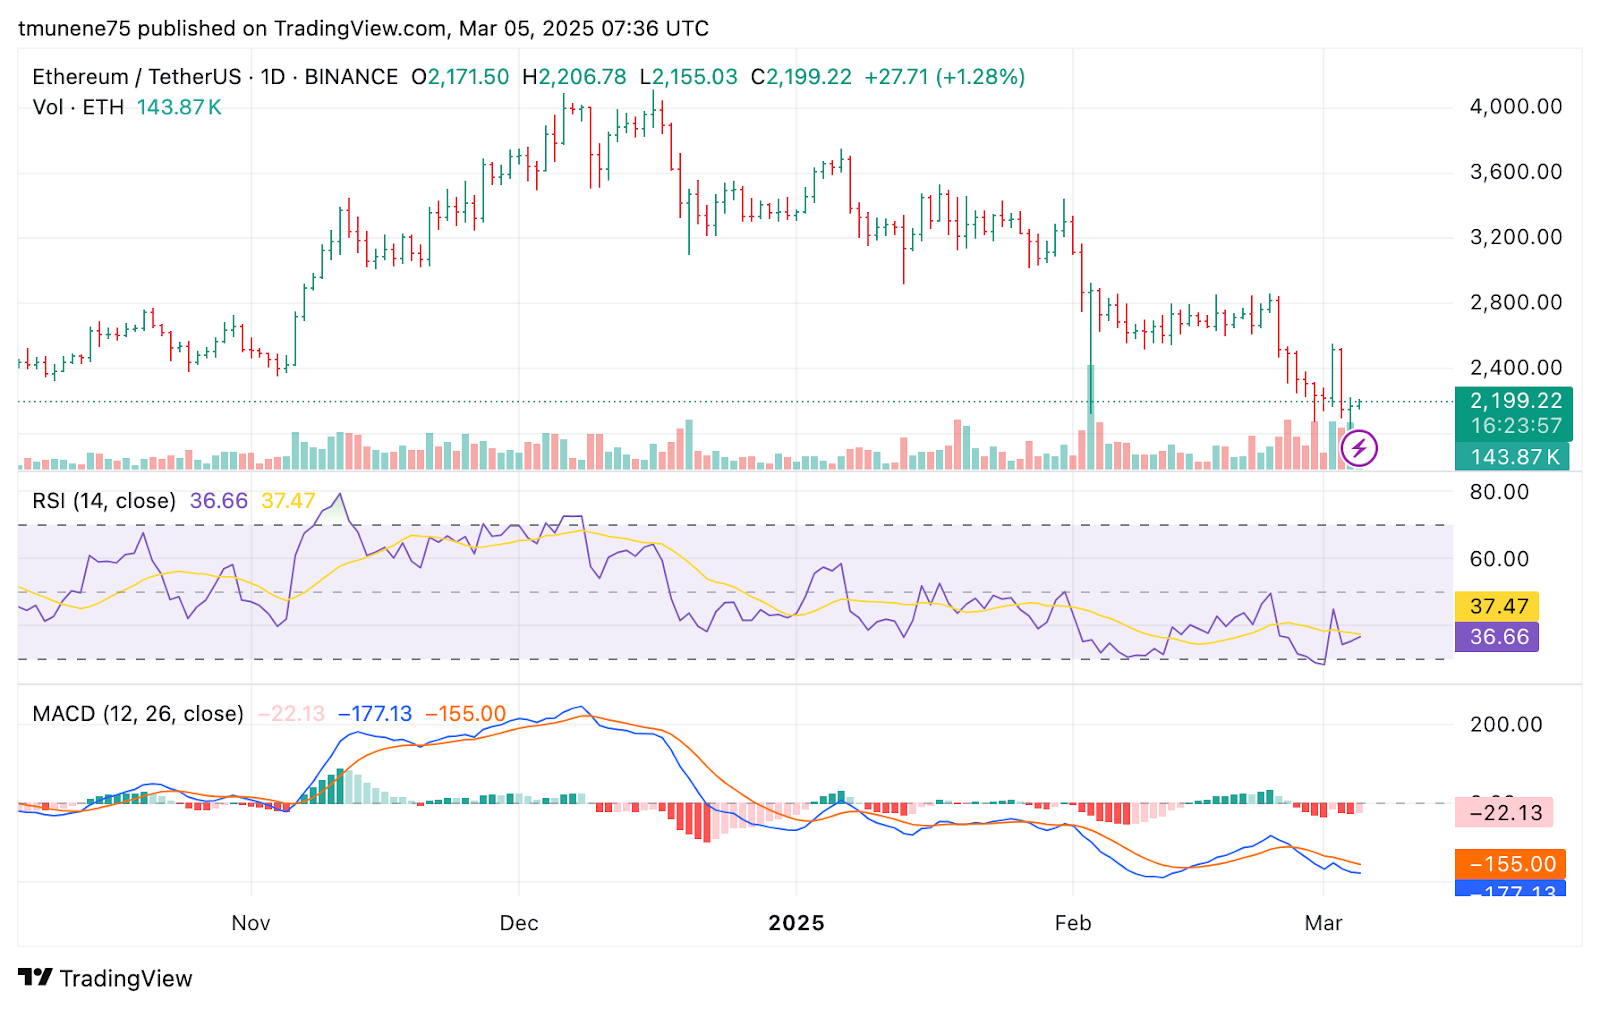
However, a drop below $2,155 may lead to further declines toward $2,000. Trading volume is at 143.88K, indicating moderate activity. Volume spikes suggest buying interest at lower levels.
The RSI is at 36.69, slightly rising but still in oversold levels. The RSI moving average is at 37.47, meaning the market is weak. If the RSI surpasses 40, a bullish reversal could follow. The MACD line is at -177.08, while the signal line is at -154.99, both negative.
However, the histogram is converging, suggesting bearish momentum may be slowing. Monitoring whether ETH stays above $2,206 is essential, which could open the way to $2,300. If it loses $2,155, it may test $2,100 or lower.
Solana Holds Key Support at $140
Solana has had strong volatility, previously peaking at around $292 before dropping to a low of $123 in early March. Currently it trades between $140 and $150, with strong resistance at $180.
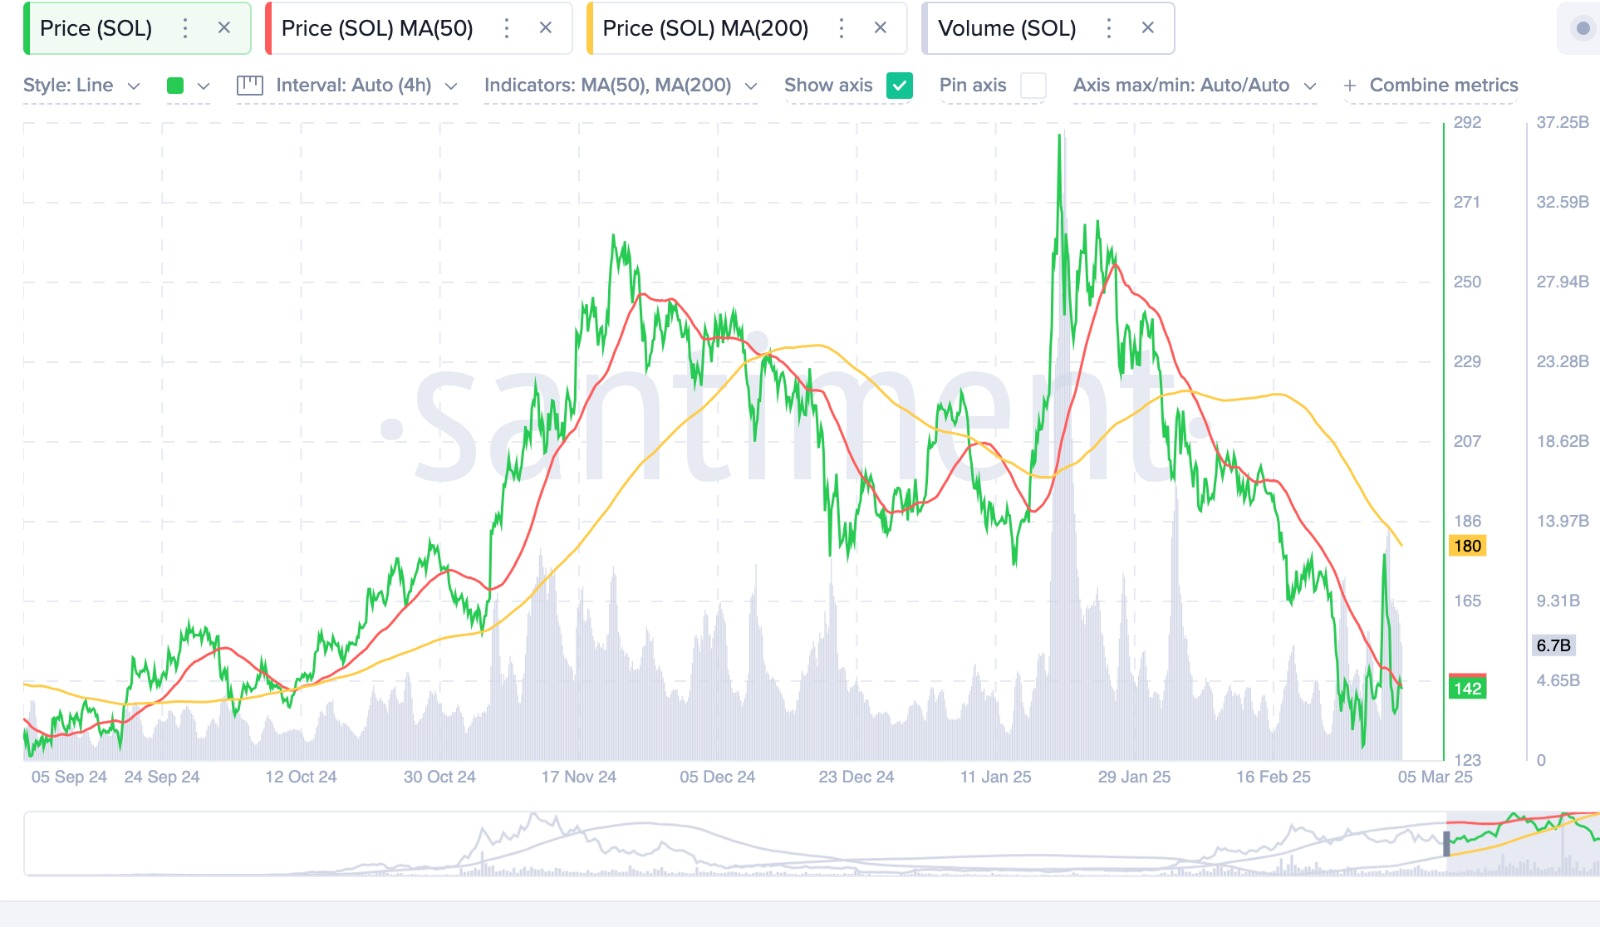
A move above this level could suggest a bullish shift, while failure to hold support may lead to further losses. The 50 day moving average is at $180, and the 200 day MA is trending downward at $186.
A “death cross” recently formed as the 50-day MA fell below the 200-day MA, historically indicating bearish momentum. However, a break above $180 could invalidate this trend. Trading volume has spiked to 6.7 billion, indicating increased market activity.
High volume in a downtrend can suggest capitulation, potentially leading to a price rebound. If SOL breaks above $150, it could test the $165-$180 range. Falling below $140 may bring $130 or lower into focus.
XRP Resistance at $2.50 With Support Near $2.40
XRP has been on a downward trend since early February after reaching a high of approximately $3.50. XRP trades within a daily range of $2.4080 to $2.5409, with key resistance at $2.95 and support at $2.06.
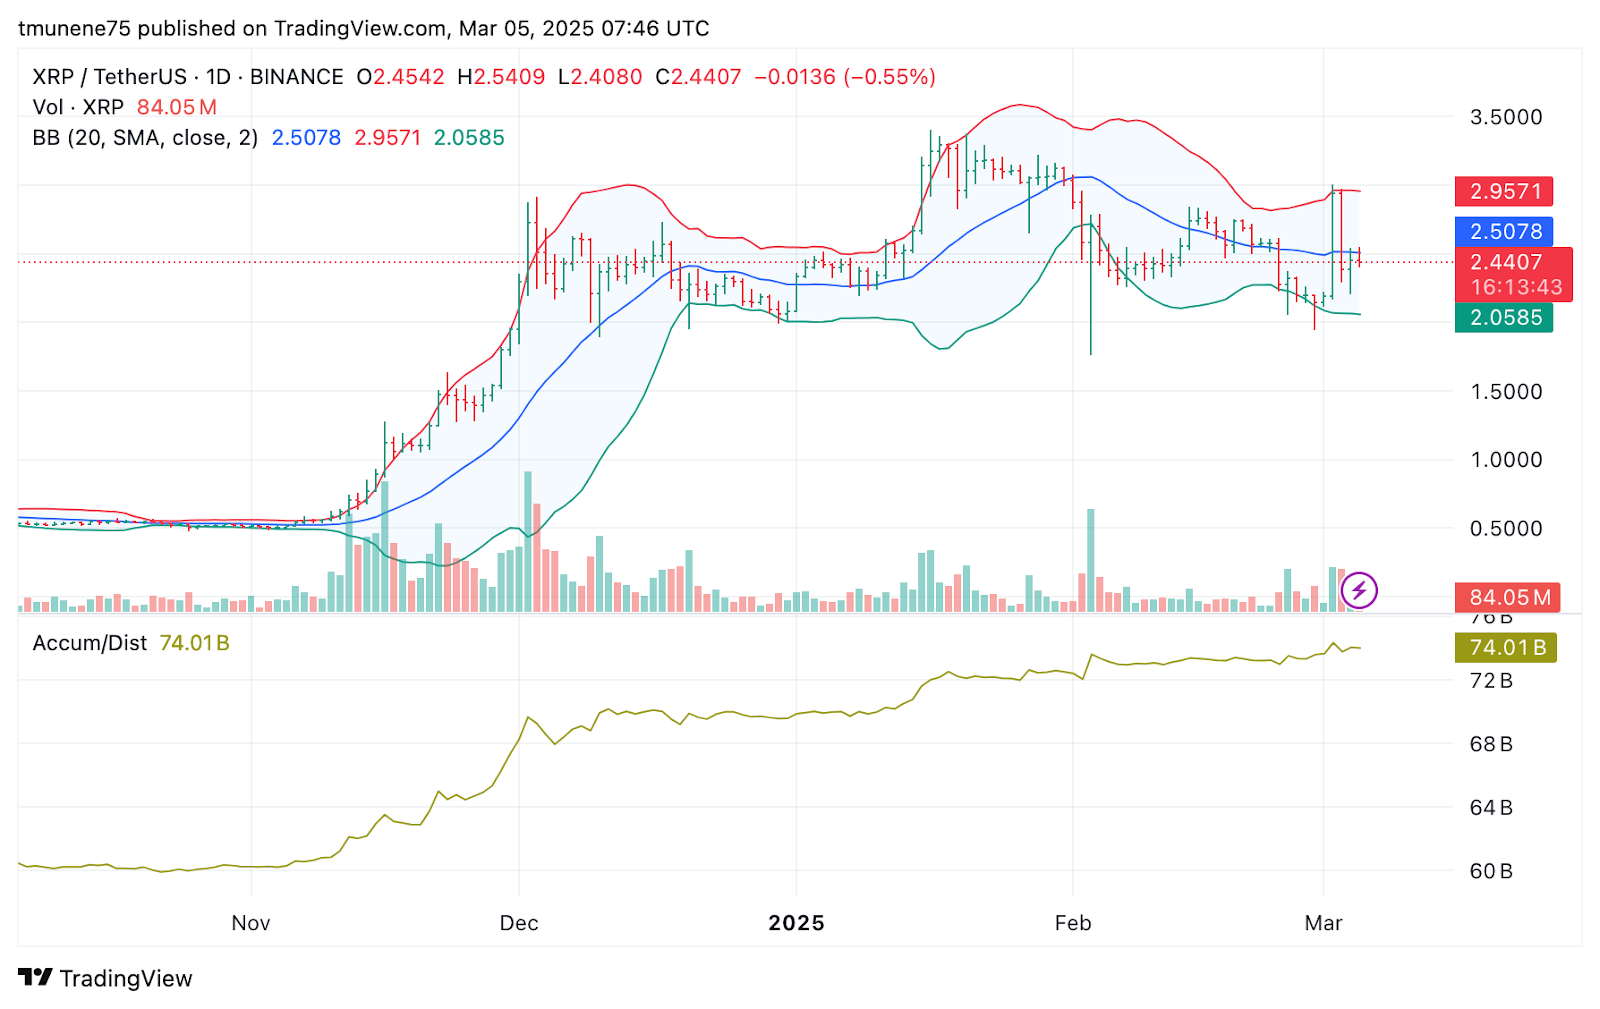
Bollinger Bands show the upper band at $2.9571, the middle band at $2.5078, and the lower band at $2.0585. XRP tested the lower band before bouncing back, though it is below the middle band, indicating bearish pressure.
A move above $2.5078 could lead to bullish momentum, while rejection may lead to further downside. XRP’s 24 hour trading volume is at 84.05 million, with accumulation/distribution levels at 74.01 billion.
The accumulation/distribution trend has flattened, showing buying pressure has stabilized after strong gains in December and January. If XRP closes above $2.50, it could target $2.75-$2.95. A drop below $2.40 could push prices to $2.20 or lower.


