
- Ethereum’s market cap fell 36% in seven weeks, pushing ETH tokens in profit to a four-month low.
- ETH ETFs saw $420M inflows from Feb 3-7, the third-largest ever, despite a 20% weekly price decline.
- Ethereum’s MVRV momentum turned negative in early Feb but rebounded, signaling a potential shift in market sentiment.
Ethereum has had a substantial market cap decline, with Santiment reporting a 36% drop over seven weeks. This downturn has reduced the number of ETH tokens in profit to a four month low.
The second largest digital asset by market cap has also faced negative sentiment, underperforming against other major assets. Despite this, some analyst Ali suggest a potential rebound if market conditions stabilize.


Ethereum Price Decline and Market Dynamics
Ethereum’s price has trended downward since early January, following a strong rally from mid November 2024. ETH’s value had surged significantly before peaking in early 2025, but it has since had a gradual decline.
Retail traders have actively offloaded ETH, further pressuring prices. Ethereum’s MVRV Momentum Oscillator shows these price fluctuations. The metric remained in negative level from July to early November 2024, correlating with ETH’s previous decline.
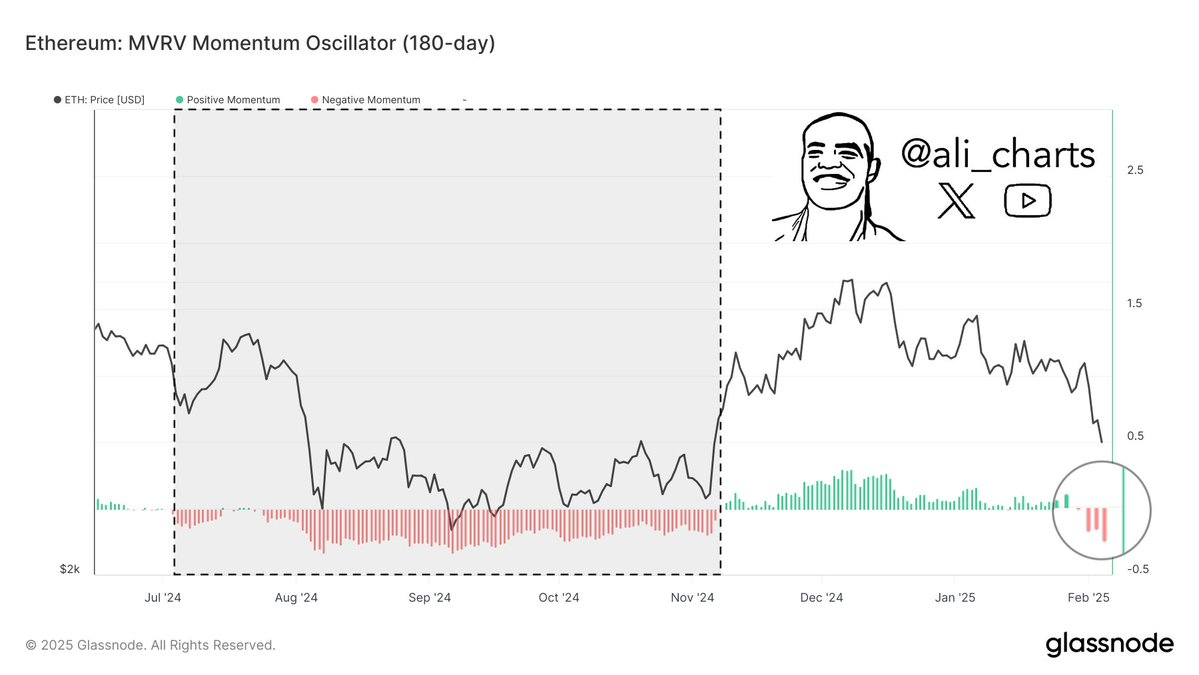
A shift to positive momentum in mid November supported the price surge, but by early February 2025, the indicator briefly turned negative before rebounding. If positive momentum holds, renewed buying interest could emerge. However, any failure to sustain this shift may lead to corrections.
Trading Volume Trends and Market Behavior
Ethereum’s price has traded between $1,000 and $4,500, having major rallies and subsequent corrections.
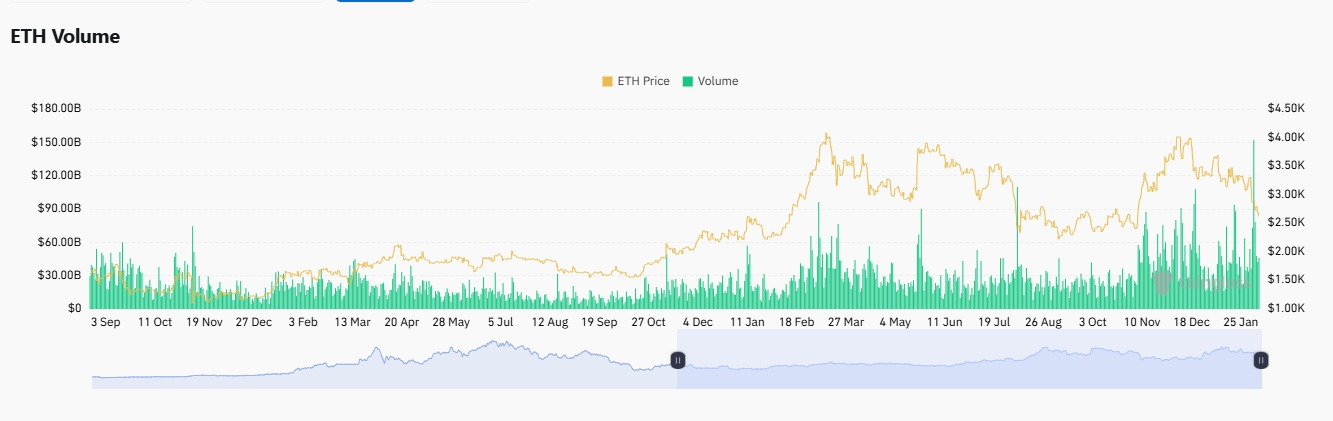
A peak above $4,000 in early 2024 was followed by a sharp decline, leading to a consolidation phase around $3,000. Another upward attempt in late 2024 saw ETH approach $3,800 before seeing resistance.
Trading volume trends show periods of strong market activity. Volume spikes have aligned with high price movements, indicating increased buying and selling activity. The highest trading volumes were recorded during key peaks, particularly in late 2023 and early 2024.
Recent months have also seen heightened volume, suggesting sustained investor interest despite price stabilization. Increasing volume alongside price stability often shows accumulation phases, while declining volume during rallies may indicate weaker momentum and potential corrections.
Ethereum Spot ETF Inflows
Ethereum’s recent price action aligns notable ETF inflows. Spot On Chain reports that between February 3 and 7, Ethereum ETFs recorded $420.2 million in net inflows, the third largest in history.
Despite this, ETH remains down approximately 20% over the week. SosoValue data further indicates no net outflows, suggesting steady institutional interest. Whale Alert reported a significant transfer of 140,493 ETH (valued at $386.6 million) from Kraken to an unknown wallet.
Large movements like these often indicate shifts in market sentiment or strategic asset repositioning. Analyst Ali, notes Ethereum’s MVRV Momentum as a key indicator for price turning points, emphasizing the importance of monitoring upcoming market reactions.


