
- Ethereum trades at $2,465.64 and is testing resistance at $2,510.28 with rising momentum against Bitcoin.
- RSI and MACD indicators show consolidation with slight bullish bias, supporting a potential breakout.
- ETH/BTC holds above the key support zone, signaling possible re-entry into the previous range if resistance breaks.
Ethereum is facing a key resistance point both in its price in U.S. Dollars and against Bitcoin. Ethereum is trading at $2,465.64 on June 26, 2025, up by 1.8% over the past 24 hours. In Bitcoin terms, ETH is up 1.3% to 0.02295 BTC. On the chart, ETH is struggling to break past the resistance of $2,510.28, with price action in recent days suggesting it could return to a higher range.
Ethereum Targets Range Re-Entry
On the ETH/BTC chart, Ethereum previously broke above key resistance points, taking liquidity across earlier highs. Since then, it has pulled back but maintained a series of higher lows. The area between 0.0219 and 0.0222 BTC shows a clear demand zone, marked by a high timeframe support block. The chart shows that if Ethereum manages to reassert this level, a move towards $3,000 could come quickly.


Despite testing lower levels recently, price has rebounded within this block, suggesting the market continues to respect this support range. Currently, ETH is pressing against a lower high trendline, which represents the immediate resistance to break. If the price closes above this region, the next leg up may confirm entry into the former range.
Technical Indicators Show ETH Stabilizing
Technical momentum indicators show neutral to slightly bullish bias. On the hourly RSI chart, Ethereum holds a reading of 47.26. This places it near the midpoint of the 30–70 zone, with no immediate overbought or oversold signal. Notably, RSI has held above 40 during most pullbacks, indicating consistent buying interest across timeframes.
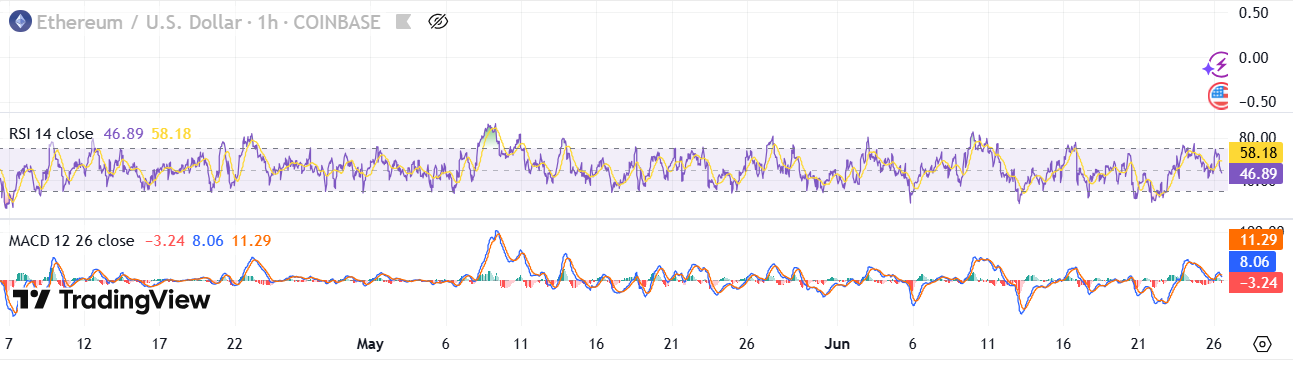
MACD readings further support this setup. MACD line is at 8.14, signal line is at 11.31 and the histogram is -3.17. These values point to continued consolidation, but the momentum carries a slight bias to the bullish reversal. Continued stability above support could lead to a crossover if price strength persists.
Critical Price Levels Define Next Move
Price structure highlights a consolidation phase above the $2,403.59 support zone. This level has been held through multiple re-tests, forming the base of the current accumulation range. On the upside, $2,510.28 stands as the resistance to reclaim. Breaking this level opens a clear path toward the $3,000 psychological zone.
In the meantime, the performance against the Bitcoin pair ETH is essential. Should ETH/BTC return to its former range, this would be a sign of overall confidence in Ethereum being long. Traders are keenly watching to see whether sufficient buy pressure can drive the price past the local barrier.


