
- Ethereum struggles below $2,500 as strong resistance limits rebound potential.
- RSI near oversold, hinting at possible short-term ETH price recovery.
- Bearish MACD, but a forming crossover may signal an upcoming ETH price bounce.
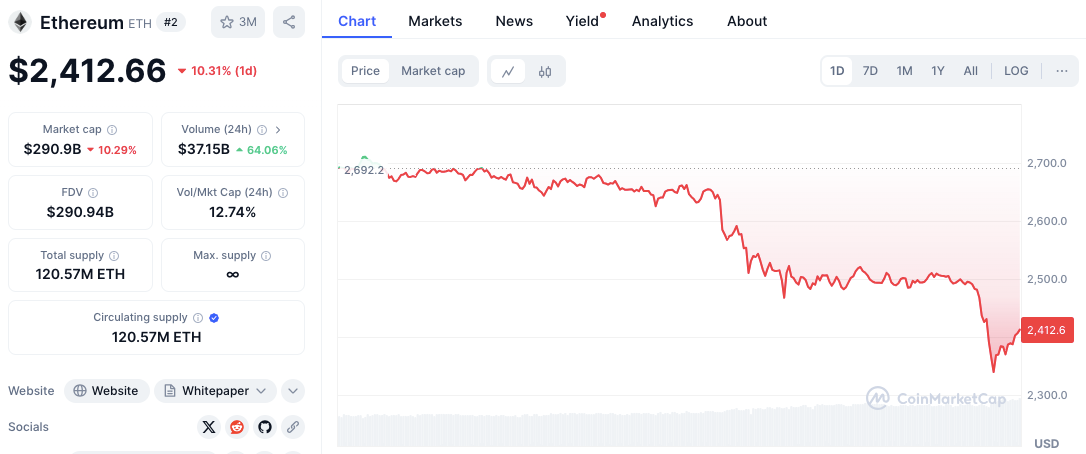
Ethereum (ETH) has experienced a sharp decline, falling from $2,692 to $2,409, marking a significant downtrend. The price has struggled to hold above key support levels, indicating strong selling pressure. With a daily drop of 10.49%, Ethereum’s market cap now stands at $290.55 billion.
Meanwhile, trading volume has surged by 63.54%, reaching $36.29 billion. This increase suggests heightened market activity, possibly driven by panic selling or speculative trading. Despite the bearish momentum, certain technical indicators hint at potential recovery if buying pressure strengthens.


Support and Resistance Levels Indicate Critical Price Zones
Ethereum faces immediate resistance between $2,500 and $2,520. This level previously acted as a consolidation zone before the price dropped further. If ETH attempts a rebound, this region may pose a challenge.
Strong resistance lies between $2,650 and $2,700, where the price remained relatively stable before the recent decline. A breakout above this range could signal a reversal, but sustained buying pressure would be necessary.
On the downside, Ethereum has immediate support between $2,350 and $2,370. The price briefly stabilized in this zone before attempting a slight recovery. If this support fails, the next critical level is $2,300 to $2,320, which could determine whether ETH remains above $2,300 or falls toward $2,200. Given the sharp decline, a breach of this level could result in further downside movement.
Technical Indicators Suggest Possible Short-Term Rebound
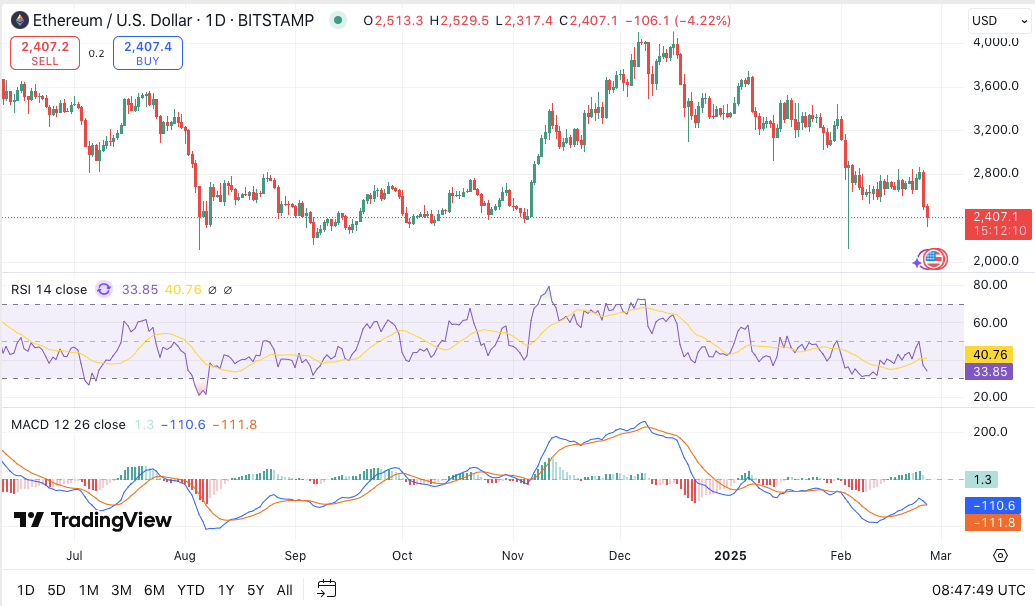
The Relative Strength Index (RSI) currently sits at 33.84, close to the oversold threshold of 30. This reading suggests that selling pressure may be overextended, potentially allowing for a short-term recovery. However, the overall trend remains bearish unless a clear reversal occurs.
The Moving Average Convergence Divergence (MACD) indicator also signals ongoing bearish momentum. Both the signal and MACD lines are positioned below zero, reinforcing the downtrend.
However, a potential bullish crossover appears to be forming. If confirmed, it could suggest an upcoming price bounce, though sustained upward movement would require stronger buying volume.


