
- ETH remains below the 50-day at $2,002 and 200-day at $2,094 MAs, confirming a bearish trend with resistance at $1,954 and $2,084.
- Whale transfers and $165M in liquidations increase volatility, while ETH consolidates between $1,823 support and $1,954 resistance.
- A breakout above $2,050 could push ETH to $2,200, while failure to hold $1,823 support may lead to a decline toward $1,750.
Ethereum has had increased market activity, with notable whale movements and liquidations. Analyst Ali reported that over 200,000 ETH had moved in two weeks, while $165 million in long positions were liquidated. Whale Alert noted a transfer of 30,650 ETH, worth over $57.6 million, to Galaxy Digital.
Meanwhile, Spot On Chain observed two wallets dumping 14,064 ETH for $27.5 million in DAI, with the ETH originating from THORChain and Chainflip. At press time on March 29, ETH was trading at $1,881.99, down by 1.27% in the past 24 hours, 5.31% over the week, and 20.43% for the month.


Market Trends and Technical Indicators
ETH trades between $1,875.41 and $1,913.60 on March 29, with a 24-hour trading volume of 95,070 ETH.
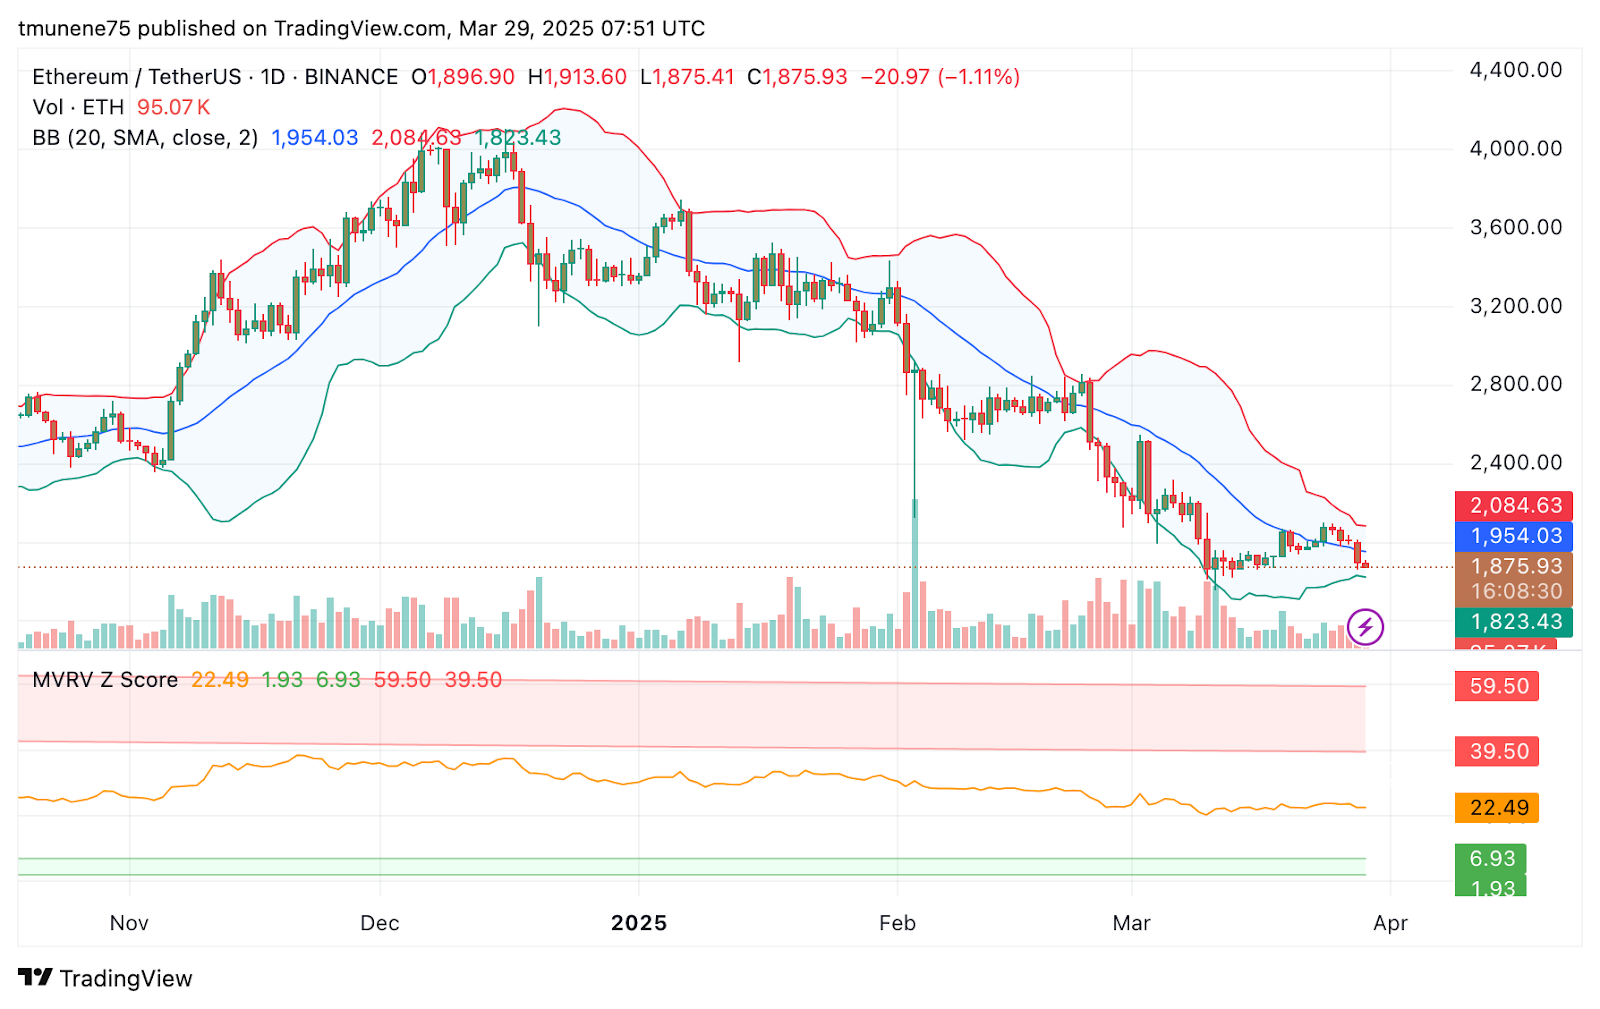
Bollinger Bands indicate the price is near oversold levels, with the lower band at $1,823.43 and the upper band at $2,084.63. The 20-day simple moving average at $1,954.03 acted as a key resistance level.
Ethereum has been in a downtrend since early February, consistently staying below the 20-day SMA, showing weak bullish momentum. The price consolidation between $1,823 and $1,954 shows market indecision.
Support and Resistance Levels
ETH’s support levels include $1,823, aligned with the lower Bollinger Band, and the psychological support at $1,800. On the upside, resistance is at $1,954, marked by the 20-day SMA, and $2,084, corresponding to the upper Bollinger Band.
The MVRV Z-Score, measuring ETH’s valuation relative to historical data, is at 22.49. While below the overvaluation level of 59.50, it remains above deep undervaluation levels, suggesting the price could be near a bottom.
Potential Price Scenarios for April 1
The 50-day moving average at $2,002 and the 200-day moving average at $2,094 show a bearish trend, as ETH trades below both levels. The formation of a death cross, where the MA50 is below the MA200, emphasizes the downward momentum.
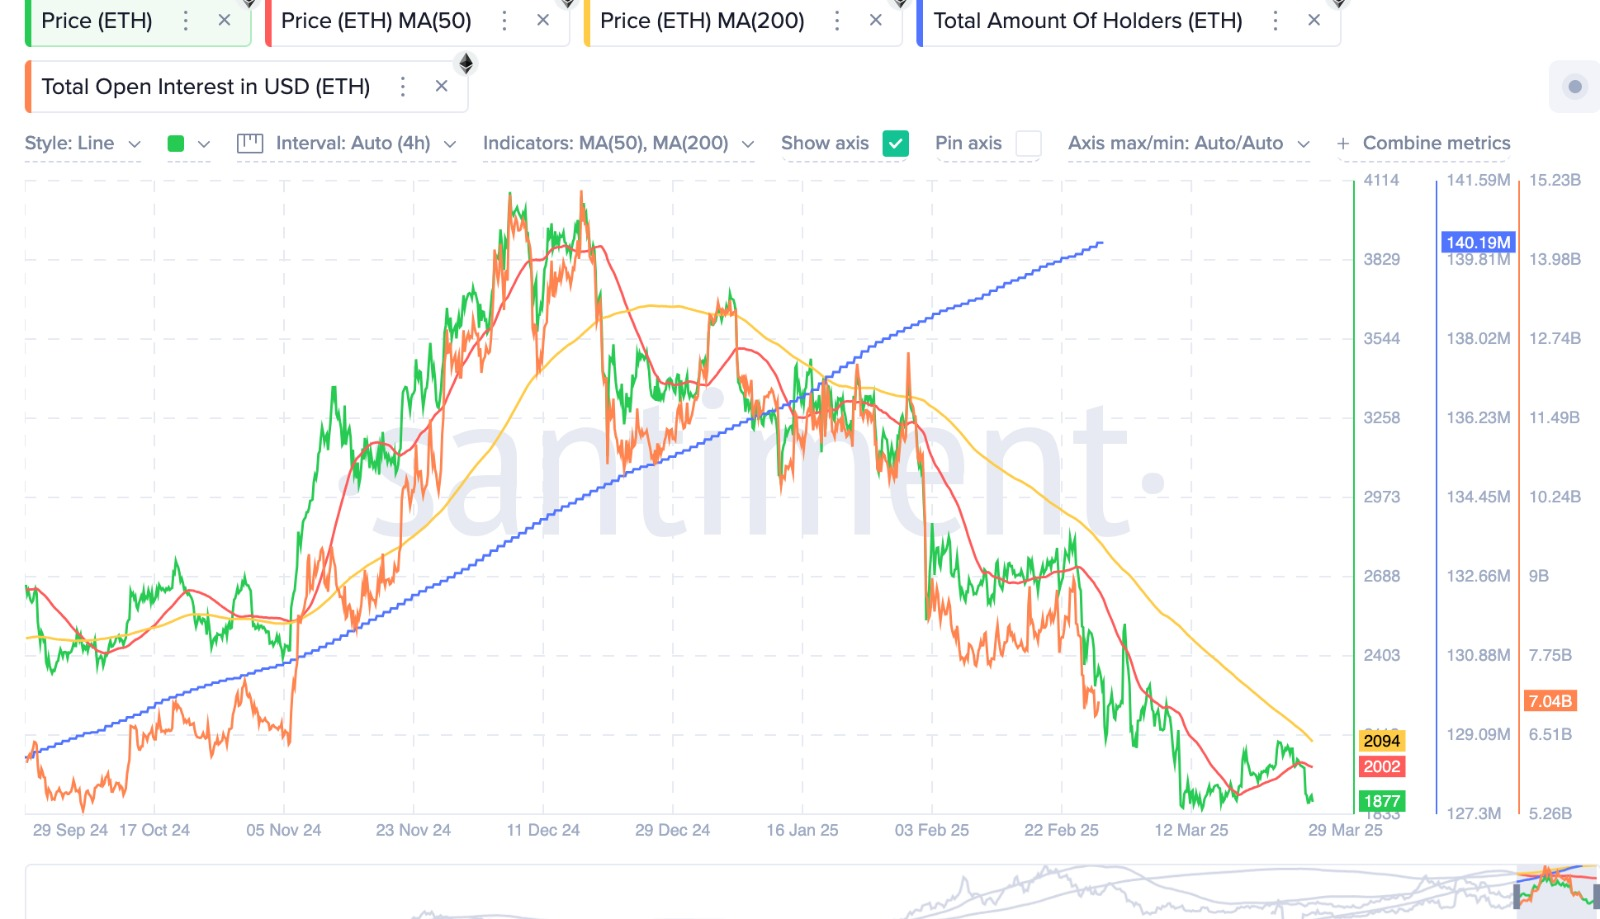
Open interest in ETH derivatives is at $7.04 billion, indicating active speculation, while the total number of holders remains stable at 140.19 million. A bullish breakout above $1,954 could push ETH toward $2,084, with further gains possible up to $2,200.
If ETH surpasses $2,002, a recovery toward $2,094 may be possible. However, a drop below $1,823 could lead to a decline to $1,750, reinforcing bearish pressure. If ETH breaks above $2,050, it could surge toward $2,200, while a bearish scenario could push the price down to $1,750 – $1,850.


