
- Bitcoin maintains a position close to $80K but could experience additional losses if it breaks its current support.
- The current market condition points toward increasing selling pressure as shown by the MACD and RSI indicating another drop may be forthcoming.
- The market will experience heightened volatility as trading options hold significant interest within the $78K-$75K price zone.
Trump established a strategic Bitcoin reserve with a firm “never sell” policy, aiming to strengthen U.S. holdings in the cryptocurrency. However, with Bitcoin’s recent price decline, the White House has reported a staggering $17 billion loss from early Bitcoin sales.
Meanwhile, Bitcoin is currently trading at $82,295.87 down 4.4% for the day, and a 24-hour range fluctuating between $80,123.98 and $86,104.85 indicating notable volatility.Despite the drop, Bitcoin remains above the critical $80K level. The 0.0% change for 1 BTC suggests stability in the immediate moment, but overall, the decline signals a potential market correction or profit-taking phase after a recent rally.


Bitcoin Braces for Volatility at Key Support
According to CryptoHayes, Bitcoin has had a rough start to the week with signs pointing to a potential retest of $78K. If that level doesn’t hold, $75K could be the next target. There’s a significant amount of open interest in options between $70K and $75K, which means if BTC enters that range, we could see some serious volatility ahead.
An ugly start to the week. Looks like $BTC will retest $78k. If it fails, $75k is next in the crosshairs. There are a lot of options OI struck $70-$75k, if we get into that range it will be violent. pic.twitter.com/q4cq0rthGJ
— Arthur Hayes (@CryptoHayes) March 9, 2025
Recent Bitcoin price drops caused significant challenges to essential support thresholds. The market started its downward trend from the February high point of $96,000 and currently maintains a value below $84,000. Traders analyze the crucial $80,000 support area as Bitcoin approaches it after a price drop below $84,000.
Bitcoin Key Indicators Signal Bearish Momentum
The MACD line is displaying bearish momentum, with the MACD line at -446, signal line at -2,772, and histogram at -3,218, suggesting a downward trend with increasing selling pressure.
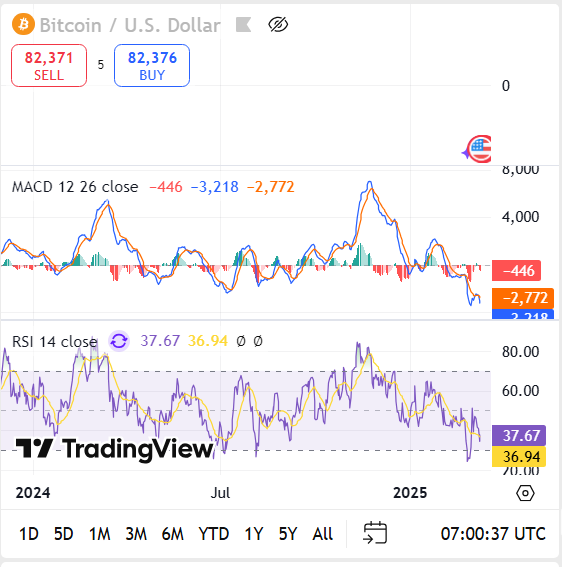
Meanwhile, the RSI is at 37.67 indicates that Bitcoin is approaching oversold conditions. However, with the RSI still above 30, there is room for further decline.The overall technical indicators suggest that Bitcoin is in a bearish phase, testing key support levels.
Key Support and Resistance Levels
The price of BTC would likely reach the $88,000-$90,000 range if it breaks through resistance at $84,000-$86,000 while staying above $80,000 support. A drop below $80,000 marks a potential starting point for BTC to decline towards levels of $78,000 or potentially reach $75,000 while leading to heightened market volatility.


