
- BONK surges by 20% after 2x Long ETF filing; July 16 launch speculation boosts inflows and trader positioning.
- Price trades above 20-day SMA and eyes upper Bollinger Band, suggesting bullish short-term momentum with rising volatility.
- Accumulation line flattens after heavy outflows, suggesting easing sell pressure despite fragile on-chain sentiment.
BONK is displaying early signs of a potential recovery, following sustained downward pressure since March. The shift comes after Tuttle Capital submitted a post-effective amendment to the SEC, targeting a leveraged 2x Long BONK ETF.
According to the filing, the product may go live as early as July 16. This has fueled speculation among traders, who are positioning for possible institutional inflows. In response, spot net inflows into BONK have increased, suggesting renewed investor interest in the memecoin.


ETF Filing and Burn Plans Fuel Market Sentiment
The announcement of Tuttle Capital’s ETF filing has re-awakened optimism in the BONK market. Traders expect the leveraged fund to potentially bring more liquidity. The surge in attention coincided with BONK’s 20% price jump, backed by on-chain support.
According to pseudonymous analyst World of Charts on X, BONK has completed a breakout and successful retest. He anticipates continued recovery over the coming sessions. Meanwhile, the BONK team revealed plans to burn 1 trillion tokens once the project reaches 1 million holders.
If triggered, this reduction in supply could influence market outlook, depending on how demand grows in the short term. The token burn announcement comes as trading volumes hit 2.07 trillion, indicating increased activity.
On-Chain Metrics and Technical Recovery Patterns
Glassnode data shows a sharp rise in BONK’s Activity Retention Rate, which tracks user consistency across 30-day periods. This metric suggests that more users are returning after previous activity, implying increased utility and engagement.
The trend supports BONK’s recent rebound from the lower Bollinger Band at $0.00001220. Technically, BONK now trades above the 20-day Simple Moving Average (SMA) at $0.00001423.
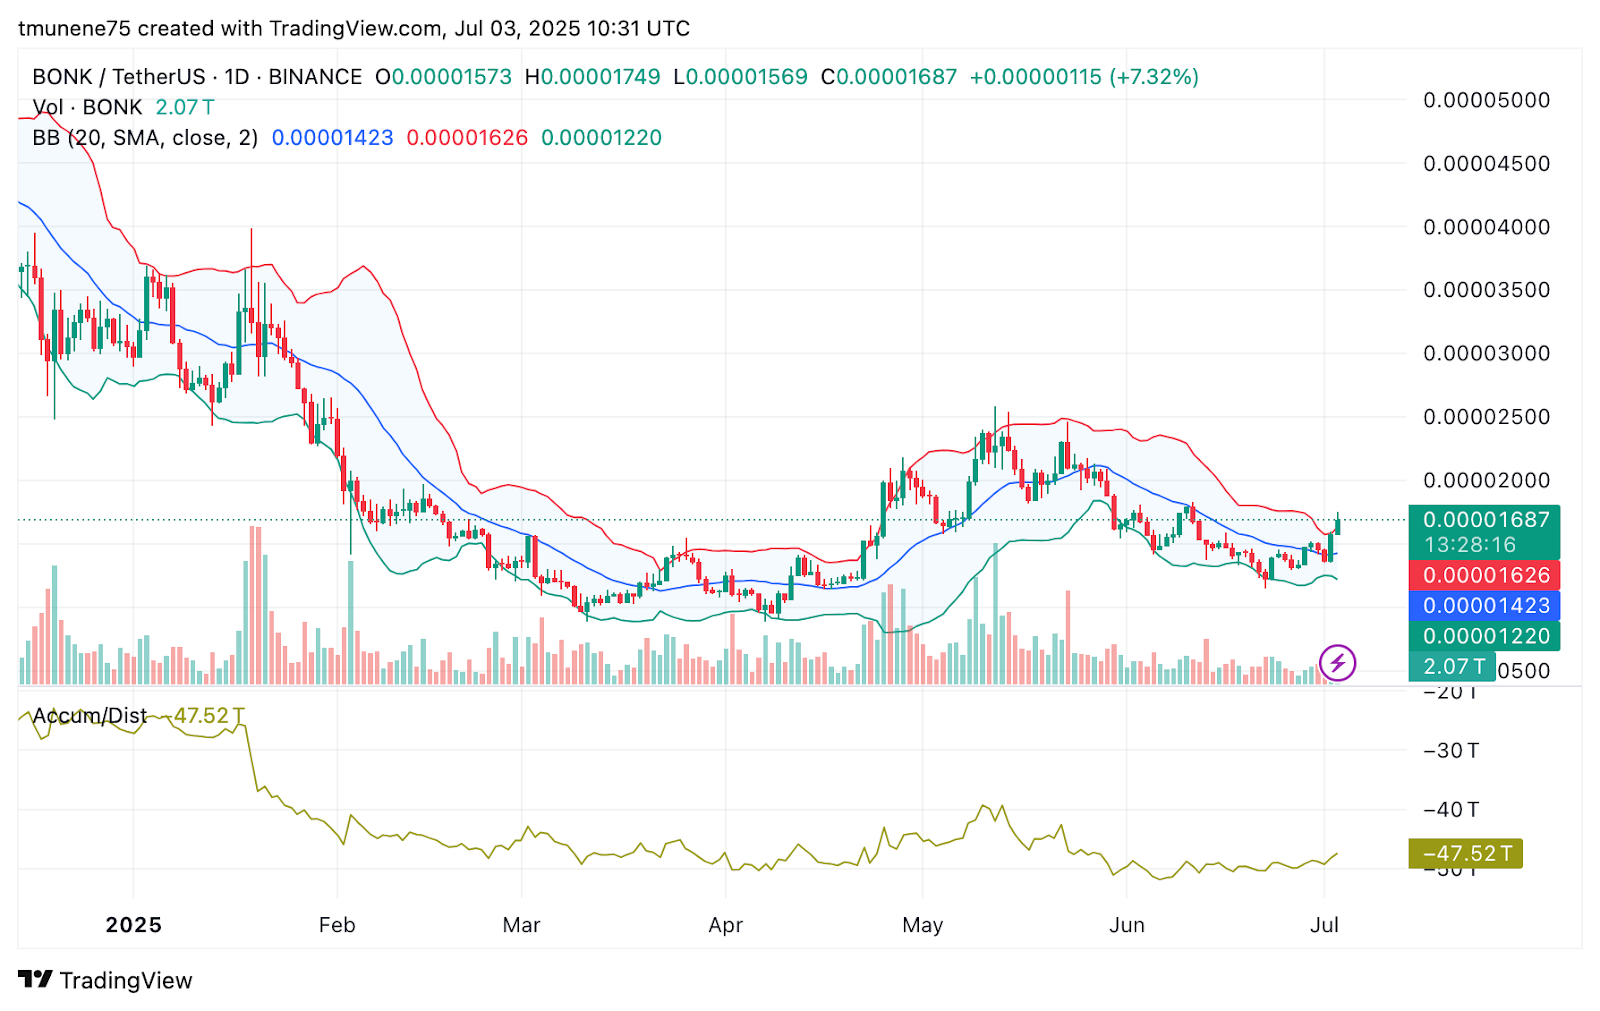
It is currently pushing toward the upper Bollinger Band at $0.00001626. Notably, the Bollinger Bands are expanding, often a sign of increased volatility. Volume is strong, further supporting the upward bias in the short term.
Key Indicators Hint at Shift in Accumulation Trend
Despite the Accumulation/Distribution (A/D) line being deeply negative at -47.52T, it is showing early signs of flattening. This change suggests that previous selling pressure could be easing, although the metric remains fragile.
Immediate resistance is near $0.00001750, with a psychological barrier at $0.00002000. Support levels are around $0.00001423 and $0.00001220, offering possible pullback zones.
BONK Price Forecast Range for July 04
If current momentum holds and trading volume remains high, BONK could test the $0.00001780–$0.00001850 range. However, if support at $0.00001620 fails, a decline toward $0.00001480–$0.00001420 may occur.
BONK’s short-term outlook has changed due to regulatory filings and tokenomics developments. Rising volume, a breakout above key technical levels, and higher user engagement support a bullish view. Still, overbought conditions and weak accumulation data suggest that volatility may remain elevated in the days ahead.
Disclaimer : The content shared by The Daily Crypto Post is intended for informational and educational purposes only and does not constitute financial or investment advice. Readers are encouraged to do their own research or consult with a licensed professional before making any financial decisions. The Daily Crypto Post will not be accountable for any financial losses.edited 04:21 PM


