
- BlackRock resumes ETH accumulation with $98M buy after brief selling pause
- Ethereum net inflows exceed $5.3B, signaling rising institutional confidence
- ETH price consolidates as technicals hint at indecision near key resistance
BlackRock is making headlines again after acquiring a massive $98 million worth of Ethereum. This renewed buying spree follows a brief pause marked by two significant sell-offs, sparking speculation across the crypto market.
However, this latest move seems to reaffirm the asset manager’s long-term bullish stance on ETH. More importantly, the latest data from Artemis shows Ethereum net inflows now exceed $5.3 billion fueling optimism about sustained institutional demand.


BLACKROCK BOUGHT $98M WORTH OF $ETH.
— Altcoin Buzz (@Altcoinbuzzio) June 25, 2025
ARTEMIS SHOWS $ETH NET INFLOWS SIT AT OVER $5.3B!!!
YOU ARE NOT BULLISH ENOUGH!!! pic.twitter.com/M3qCLXAvbB
Temporary Pause Followed by a Powerful Comeback
According to Lookonchain data, BlackRock had recently broken its 30-day ETH buying streak with two notable sell-offs. The first involved over 8,000 ETH amid price volatility, while a second sale moved another 10,500 ETH shortly afterward.
Despite that momentary deviation, the firm quickly returned to accumulation mode. Within a single hour, BlackRock executed two major transactions, withdrawing 11,185 ETH from Coinbase Prime, valued at roughly $27.2 million at the time.
BlackRock is back to buying $ETH — withdrawing 11,185 $ETH($27.2M) from Coinbase Prime in the past 30 minutes.https://t.co/VQxjY05zns pic.twitter.com/XzBSiiAHDj
— Lookonchain (@lookonchain) June 24, 2025
These moves seem tactical rather than uncertain. The quick turnaround suggests the sell-offs were more about managing liquidity during volatile swings than signaling a broader exit. Consequently, BlackRock’s rapid re-entry into the market could be interpreted as a signal of confidence in Ethereum’s medium to long-term prospects.
Ethereum Technical Picture Shows Mixed Signals
Ethereum as of press time trades around $2,434.78, posting a modest 1.3% daily gain. The price chart reflects a cautiously bullish trend. Higher lows following each retracement hint at ongoing upward pressure, although the pace remains inconsistent.
Key support lies near $2,398.5 and $2,420, both having been tested multiple times. Resistance is forming at $2,460 and $2,480. A decisive break above $2,480 could open the door to further gains. Conversely, a dip below $2,398 may signal a bearish reversal.
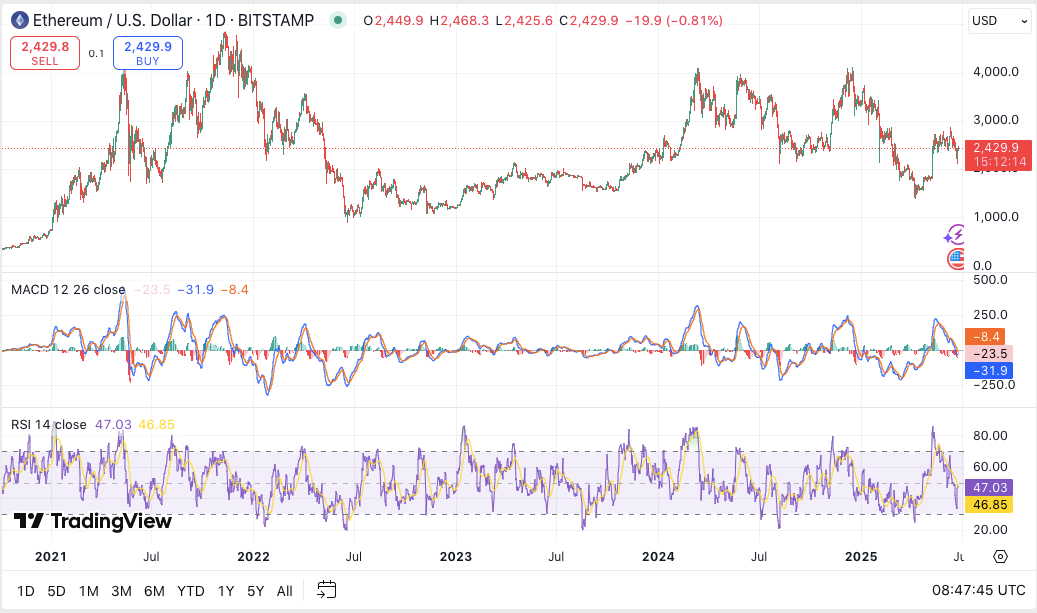
Technical indicators present a more neutral tone. The MACD is currently below both the signal and zero lines, pointing to mild bearish momentum. RSI stands at 46.97, indicating neither overbought nor oversold conditions. These readings align with a market in consolidation, waiting for a clear breakout or breakdown.


