
- Global liquidity surge supports long-term Bitcoin uptrend despite recent correction
- Major buy walls between $101K–$103.5K show strong whale interest and accumulation
- Break above $106K–$108K could trigger bullish momentum toward $110K and beyond
Bitcoin’s recent price dip has sparked concern among investors, but multiple analysts argue this is a healthy pause rather than a market top. As global liquidity shows sustained growth and major support levels hold strong, experts suggest the macro trend remains bullish. With key resistance zones being tested and large buy walls forming below current prices, the broader picture points toward continued upside possibly extending into late 2025.
Liquidity Trends Support Bullish Continuation
According to Wise Advice, the global liquidity cycle is entering a prolonged bullish phase. This is evident in the rising green histogram bars tracking global monetary inflows.


Bitcoin’s performance in Q1 2024 highlighted a pattern of quick recoveries following brief corrections. This momentum came after similar behavior in Q4 2023, indicating a reliable trend of support-driven rebounds.
Furthermore, consolidation around the $60,000–$65,000 zone established a strong base. Breakouts from this range have reaffirmed upward strength. Unless global liquidity turns negative again, Bitcoin’s macro trend supports continued gains. The sustained influx of liquidity reinforces the notion that Bitcoin’s current dip is a short-term cool-off.
GLOBAL LIQUIDITY IS SIGNALING BULLISH PHASE CONTINUATION.#BTC's ongoing correction is just a cool-off and not a top.
— Wise Advice (@wiseadvicesumit) June 2, 2025
Study Q4 2024 and Q1 2024, and you'll understand what's coming next 🚀 pic.twitter.com/oTzAEeZkzY
Key Price Levels and Technical Insights
Analyst EGRAG CRYPTO highlights a crucial price target: a daily close above $104,674. This level aligns with the 21-day Exponential Moving Average and the 0.888 Fibonacci level.
Breaking and holding above this mark would confirm bullish momentum. However, a failure to sustain this could lead to a retest of the 0.618 Fibonacci level. If that support breaks, Bitcoin might temporarily wick down to the 0.5 zone.
#BTC – Daily Close Above $104,674 Is Bullish! 📈
— EGRAG CRYPTO (@egragcrypto) June 2, 2025
For #BTC to remain bullish, it must close above $104,674 on the daily chart. This level aligns with the 21 EMA and the Fib 0.888 – signaling strong bullish momentum. 💪✨
However, a different scenario could play out:
A #Bearish… pic.twitter.com/h0Q6wmMkC9
Meanwhile, Michaël van de Poppe identifies $105,800 as a major resistance level. Bitcoin’s failure to hold above this zone has triggered a minor downtrend.
With current support around $100,739 and a deeper level at $91,772, he anticipates further downside before an upward reversal. The weak Relative Strength Index and increased selling volume confirm this cautious outlook.
Whale Activity Signals Strong Demand
Cryptopatel notes massive whale accumulation between $101,000 and $103,500. These buy walls show where institutional investors are placing significant bets. Bitcoin has already bounced from this range, reinforcing it as a strong demand zone.
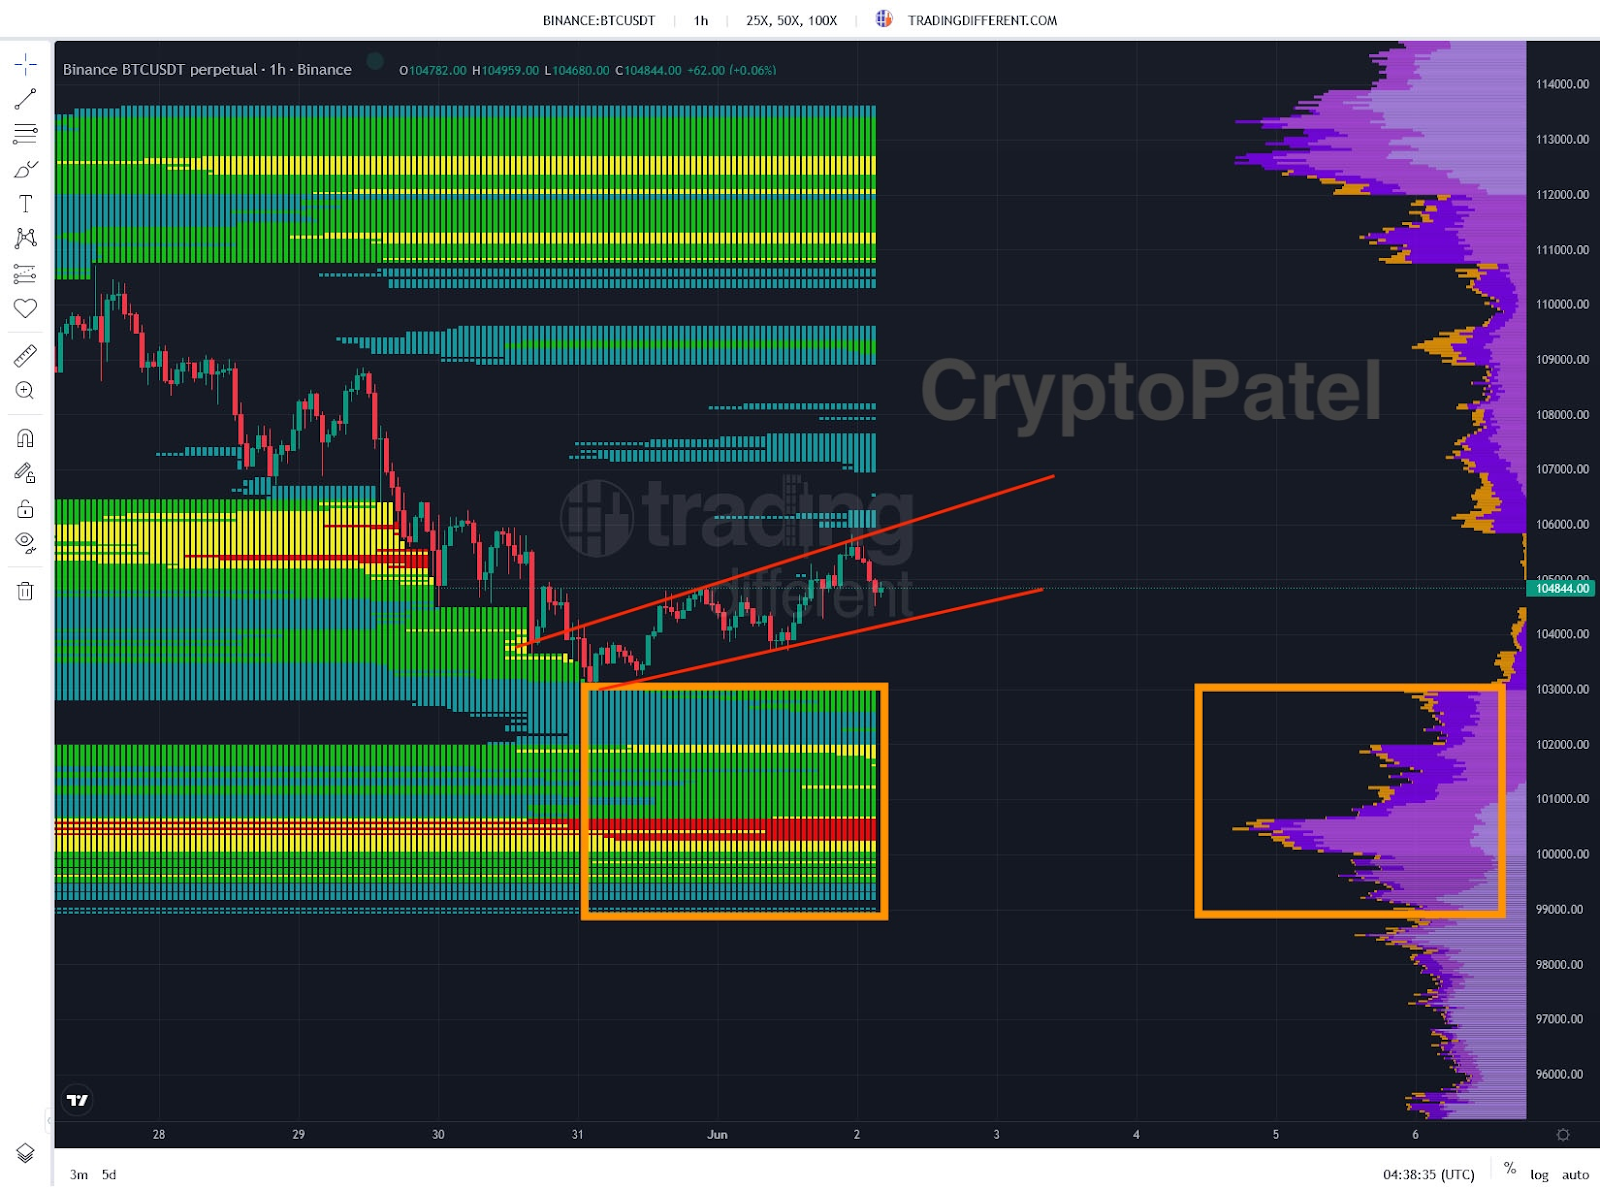
The next hurdle lies between $106,000 and $108,000. If the price breaks above, a rally toward $110,000 and beyond becomes likely.
As of press time, Bitcoin is trading at $104,081, reflecting a slight daily dip and a 5.14% loss over the past week.


