- XRP’s breakout from a multi year triangle hints at a rally, with targets at $3.40, $5, and $8 if bullish momentum holds.
- The MA50 at $2.35 supports XRP, while MA200 at $2.50 acts as resistance. A break above could lead to another bullish wave.
- Trading volume near 6.11B suggests renewed interest, supporting the potential for a surge if XRP maintains support above $2.35.
According to Javon Marks, XRP’s latest breakout resembles the 2017 surge but on a much larger scale. He suggests that the current rally could surpass expectations if the bullish momentum sustains. Another analyst, Dark Defender, notes that XRP has cleared a key resistance level, which may lead to a potential all-time high.
The pattern that $XRP broke out of in November 2024 is highly similar to that 2017 Breakout pattern and
— JAVON⚡️MARKS (@JavonTM1) March 5, 2025
MORE THAN 2X LARGER 😱!
This run can be far from complete and prices can be in the midst of a climb that's greater than many think or even imagine to possible… pic.twitter.com/GHoWYNPSQh
Historical Breakout Shows Strong Bullish Potential
XRP’s market pattern shows repeating macro patterns, with two symmetrical triangles forming over the years. The first pattern from 2013 to 2017 led to an explosive rally, pushing XRP to an all time high of $3.40 in early 2018.


The second pattern, spanning from 2018 to 2024, has recently broken out, hinting at another bullish phase. Support and resistance levels are crucial in determining XRP’s next price movement. The key support range between $0.40 and $0.60 was tested multiple times before the breakout.
Now, resistance near $3.40 is an important level to monitor. If XRP surpasses this point, further targets at $5, $8, and even $13 are possible based on Fibonacci extensions. The parabolic curve also aligns with past breakout trends, supporting the likelihood of a sustained upward move.
Technical Indicators Show Sustained Momentum
The 4 hour timeframe indicates a sharp rally, with XRP peaking at $3.38 before pulling back. XRP Is above $2, showing strong support and recovery signs.
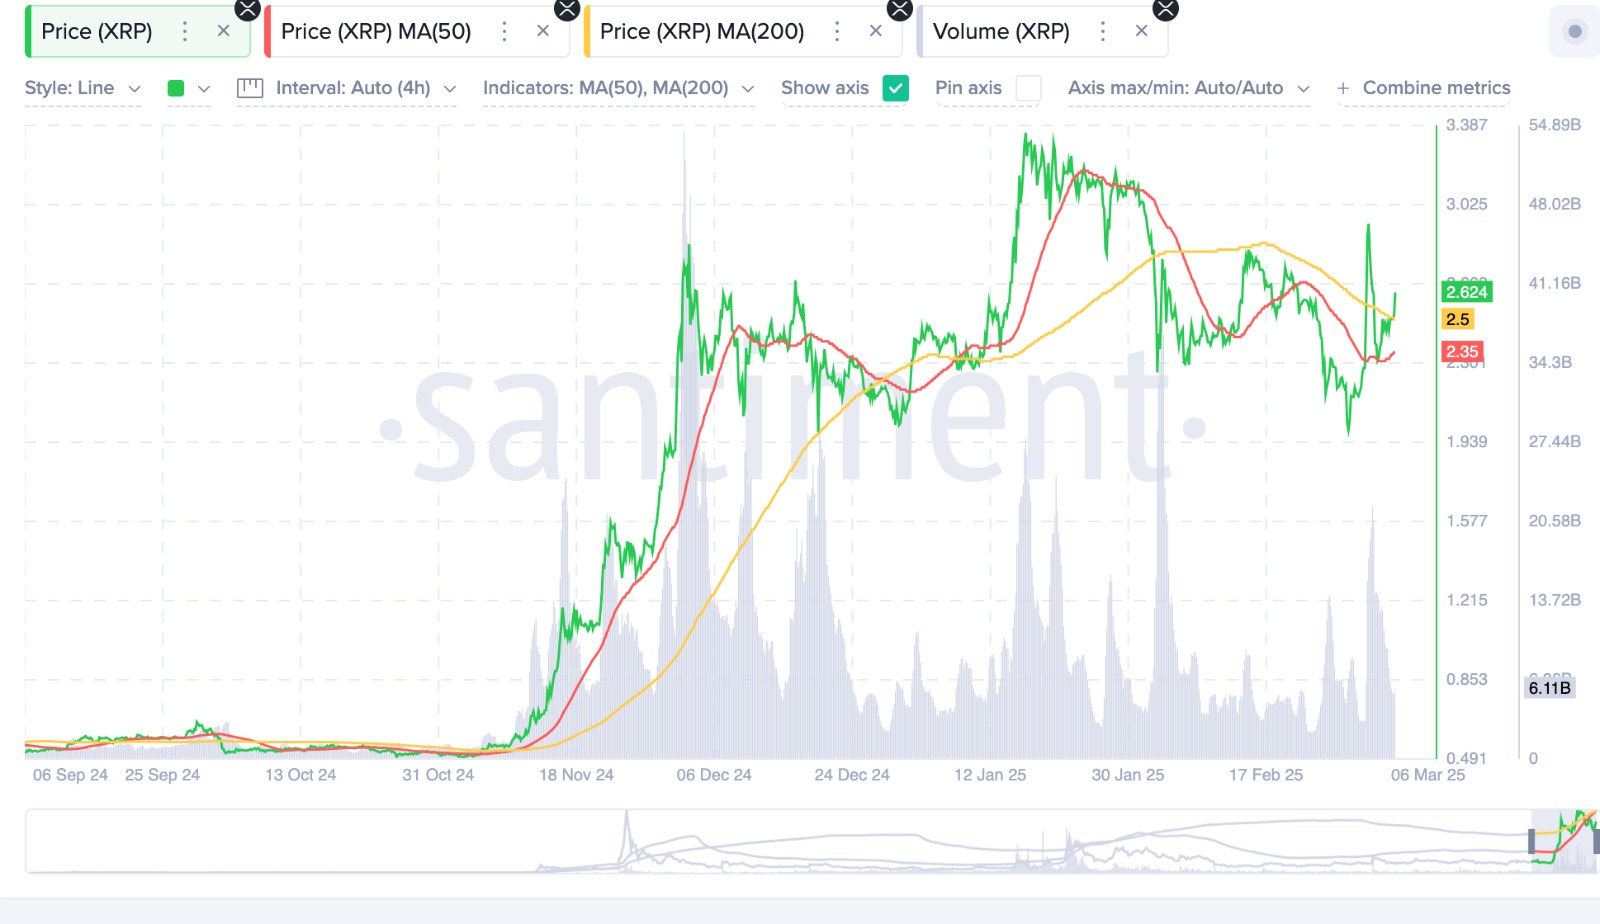
The price rebounded from $1.94 and is now trading around $2.62. A Golden Cross formed, where the 50 period moving average crossed above the 200period moving average in November 2024.
This bullish signal preceded a breakout from below $0.50 to above $3. Currently, MA50 is at $2.35, acting as immediate support, while MA200 at $2.50 serves as resistance. A decisive break above MA200 could lead to another bullish wave.
Key Levels and Market Trends
Trading volume has surged during both rallies and corrections, with peaks in December and January. Current volume near 6.11 billion suggests renewed interest, potentially supporting another upward move.
If XRP closes above MA200, it could target $3.00 and beyond. However, failure to hold above $2.35 may lead to a deeper retracement towards $1.90-$2.00 before another attempt at higher levels.
Dark Defender notes $2.22 as a critical support, with resistance levels at $3.3999 and $5.85. If XRP maintains momentum above these key levels, it could challenge its previous all time high. Market developments and sustained buying pressure will determine XRP’s next move.


