
- ADA must hold $0.72 support to maintain bullish momentum within the ascending channel
- Falling wedge pattern on 6-hour chart hints at potential breakout above $0.74
- MACD and RSI show mixed signals, urging caution despite bullish chart setups
Cardano (ADA) is at a pivotal moment as multiple technical indicators and chart patterns suggest a possible breakout or breakdown. As of press time, ADA is trading at $0.7259, showing a sharp 4.42% drop over the last 24 hours and a 12.17% decline across the past week.
Despite this pullback, analysts continue to see potential for a bullish reversal, supported by emerging technical patterns and strong support levels. With ADA hovering above key zones, investors are watching closely for the next big move.


Ascending Channel Indicates Strength if $0.72 Holds
Ali Martinez, a respected crypto analyst, highlights that ADA may be forming an ascending channel on its price chart. This pattern reflects a bullish structure, created by consistent higher highs and higher lows. The channel’s lower edge begins around $0.60 seen during early May and climbs toward the crucial support level at $0.72.
Holding above this $0.72 level is key. If ADA sustains this price, it could push towards the upper boundary of the channel at $0.92. That suggests a potential gain of 24% to 27% from current levels.
If the current structure on #Cardano $ADA is an ascending channel, holding above $0.72 could pave the way for an upswing toward $0.92. pic.twitter.com/vgNNfuudPd
— Ali (@ali_charts) May 18, 2025
Notably, the price is consolidating above $0.74, a former resistance that now acts as short-term support. If this consolidation continues without breaking down, it may set the stage for a retest of the $0.80 level, which was briefly touched earlier this month.
Falling Wedge Pattern Builds Bullish Potential
Besides the ascending channel, another bullish setup is forming according to analysts at The Crypto Express. On the 6-hour chart, ADA is consolidating within a falling wedge pattern. This formation typically precedes a bullish breakout, especially when accompanied by supportive volume and momentum indicators.
#ADA/USDT ANALYSIS
— The Crypto Express (@TheCryptoExpres) May 19, 2025
ADA is consolidating within a falling wedge pattern and is currently trading just above the support trendline. The 200MA is also positioned below the price, offering additional support.
A breakout above the wedge would confirm a bullish trend, while a… pic.twitter.com/Tjw3PzaIJt
The price sits just above the lower wedge boundary, while the 200-period moving average (MA) lies beneath it. This adds dynamic support to the structure. A breakout above $0.74, the upper trendline of the wedge, could confirm bullish momentum and push ADA toward $0.78 or higher. However, a breakdown below both the wedge and the 200MA could invalidate the pattern and send ADA sliding to $0.68 or lower.
Technical Indicators Suggest Caution Amid Opportunity
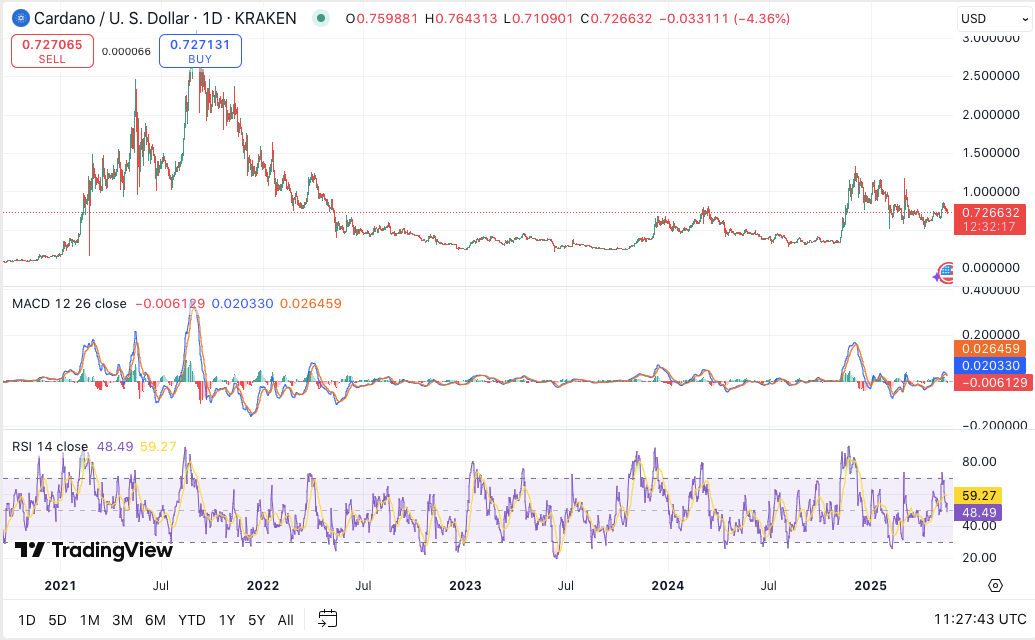
The MACD line remains slightly above the signal line, hinting at bullish sentiment. However, the MACD histogram is small, suggesting limited strength. Meanwhile, the Relative Strength Index (RSI) hovers near 48.58, indicating neutral momentum.


