
- ADA forms inverse head and shoulders, hinting at a potential short-term reversal.
- Break above $0.577 neckline and 50MA could trigger a bullish rally to $0.65.
- Bearish MACD and outflow dominance still suggest caution despite oversold RSI.
Cardano (ADA) is showing early signs of a potential trend reversal, despite facing recent price pressure. As of June 27, 2025, ADA is trading at $0.555, reflecting a 3.29% daily drop and a 6.24% decline over the past week. However, a closer look at the 4-hour chart suggests that the token could be approaching a pivotal moment.
Analyst Sssebi has identified a potential inverse head and shoulders pattern a formation often associated with bullish reversals. With this pattern in play, ADA may be gearing up for a short-term rally, provided it can break key technical barriers.


Critical Resistance at 50MA and Neckline
The neckline of this emerging pattern is near $0.577, tightly aligned with the 50-period moving average. This confluence acts as strong resistance and must be decisively breached. A successful breakout above this level could spark bullish momentum, potentially targeting the upper boundary of the descending channel around $0.65. However, failure to clear this area might push the price back toward the $0.54–$0.52 support zone.
Possible inverse head and shoulder on the 4hr $ADA chart.🚀
— Sssebi🦁 (@Av_Sebastian) June 26, 2025
Would love to see it break that 50MA first and then it's game on.
Target could be the upper trendline of the falling channel, around $0.65 https://t.co/YBk7Duh6Ql pic.twitter.com/KSyVkzgesH
Besides this, the 50MA has historically acted as a magnet for short-term traders. If ADA can break and hold above it, the move could attract increased volume and interest. Volume confirmation remains critical, as weak volume on a breakout often leads to fakeouts and quick reversals.
Technical Indicators Show Mixed Signals
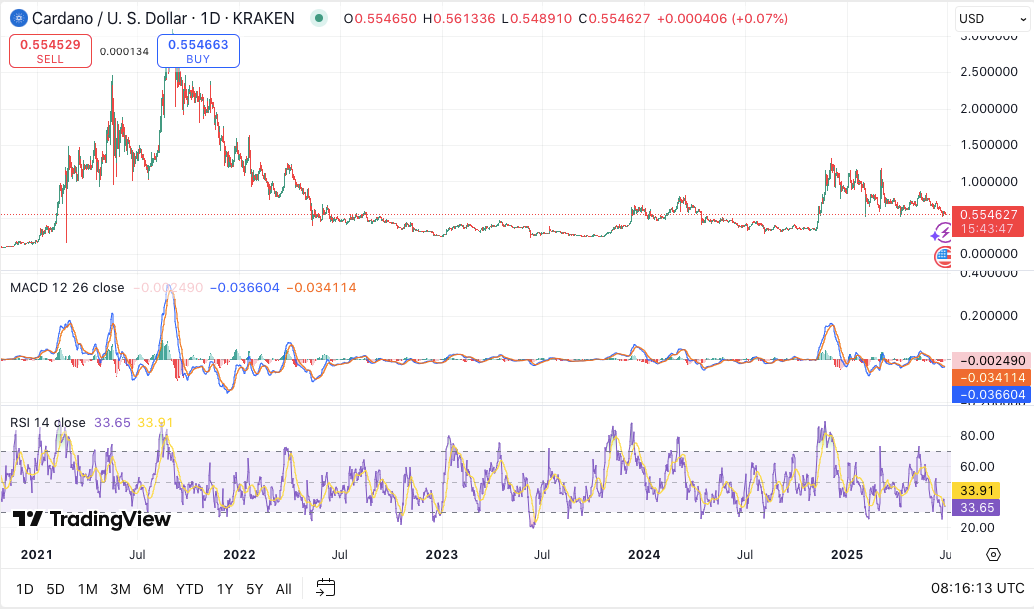
Looking at momentum indicators, the MACD remains bearish. The MACD line is currently below the signal line, and histogram bars sit in negative territory. This setup reflects continued downward momentum. There is no sign of a bullish crossover yet, keeping caution in play for now.
Meanwhile, the RSI tells a different story. Currently at 33.65, it’s nearing the oversold threshold. Historically, RSI levels below 30 often trigger short-term price rebounds. Hence, ADA may be approaching a bounce zone, although confirmation is still needed.
Outflows Reflect Bearish Sentiment
On-chain data supports the cautious outlook. ADA spot inflow/outflow charts show prolonged dominance of outflows over inflows. Major outflow spikes in December, March, and May signal consistent selling pressure.
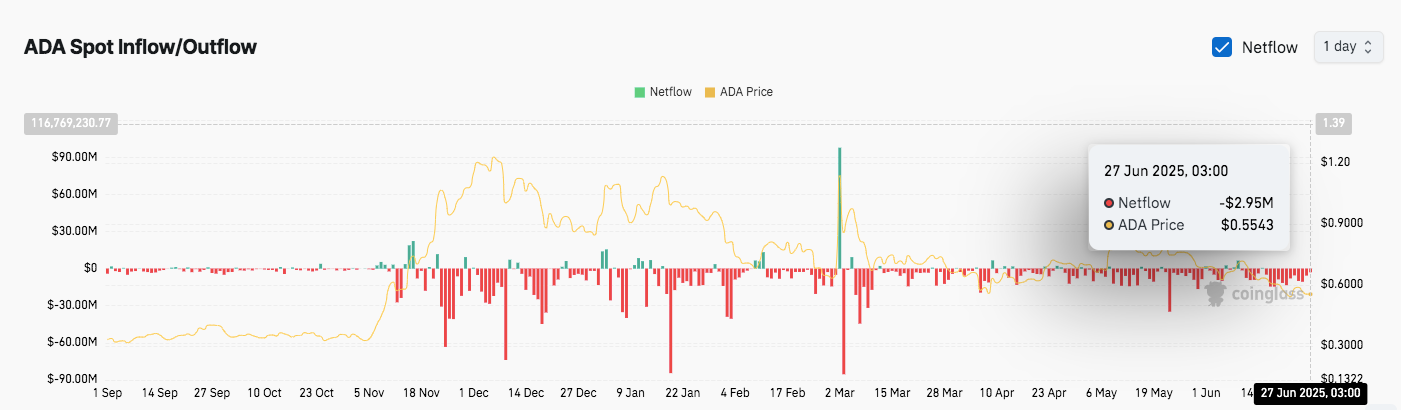
Most recently, netflow on June 27 came in at $2.95 million. This trend underlines persistent bearish sentiment, despite the bullish technical pattern forming.


