
- Bitcoin faces resistance at $85,170 and $84,500, with weak momentum limiting gains.
- Key support holds at $83,500, but waning volume raises risks of further declines.
- RSI hovers near 44.69, signaling neutral-to-bearish momentum without clear reversal signs.
Bitcoin (BTC) has experienced a dip in momentum, signaling potential short-term uncertainty. After a brief rally, the cryptocurrency retraced downward, reflecting lower highs and lower lows in the past 24 hours. This price action confirms a bearish trend, with sellers currently in control. The declining trading volume further supports this weakening momentum, suggesting cautious behavior from market participants.
Short-Term Trend: Weak Momentum and Narrow Range
At $83,776.67, Bitcoin’s price reflects a 1.48% drop over the past 24 hours. This downtrend follows a failed attempt to breach higher resistance levels early in the trading day. Subsequently, BTC faced a series of setbacks, forming a bearish price structure with reduced upward momentum.


The immediate support sits at $83,500, where buyers briefly stepped in to slow the downward slide. Additionally, a minor support zone at $83,200–$83,300 provided some stability before the recent price rebound.
These support levels act as safety nets that prevent sharper declines. However, without renewed buying interest, Bitcoin may retest these lower boundaries.

The downward price movement also reflects waning enthusiasm, especially given the decreased 24-hour trading volume of $27.23 billion, down by 5.88%. Lower volume during a dip often signals weakening momentum, increasing the risk of further declines if buyers fail to reassert control.
Resistance Zones and Selling Pressure
On the upside, Bitcoin continues to face resistance at critical price levels. The $85,170 mark stands out as the highest price achieved during the last 24 hours. This level reflects heightened selling pressure, where Bitcoin failed to sustain upward momentum.
Additionally, the $84,500–$84,800 range remains a key resistance zone, where BTC previously struggled to break higher. These barriers may hinder any immediate recovery unless renewed bullish momentum drives prices beyond these thresholds.
Technical Indicators: Mixed Signals for Bitcoin’s Next Move
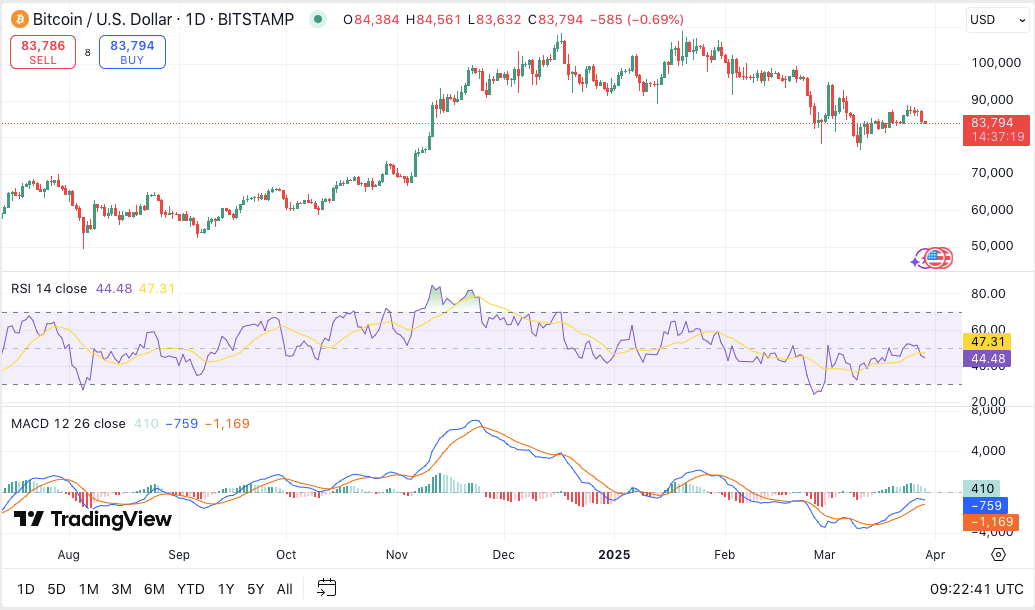
Bitcoin’s technical indicators present mixed signals. The Relative Strength Index (RSI) currently stands at 44.69, hovering in neutral-to-bearish territory. This level suggests that Bitcoin is neither oversold nor overbought, indicating weak momentum without immediate signs of a reversal.
Moreover, the Moving Average Convergence Divergence (MACD) shows a slight improvement. A recent bullish crossover occurred as the MACD line crossed above the signal line. However, the histogram remains negative, though shrinking, signaling that momentum is still fragile.


