
- TRX surged 2.87% to $0.23, fueled by Justin Sun’s announcement of Solana integration, boosting investor optimism.
- TRX faces resistance at $0.2317; a breakout could push prices to $0.2501, while a drop below $0.2292 may lead to $0.2133 support.
- 89% of TRX holders are in profit, with large transactions reaching $2.04B in seven days, signaling strong market activity.
Tron (TRX) is trading at $0.23 on Wednesday, at the time of publication, after rising by 2.87% in the past 24 hours and 3.88% over the past week. The recent surge follows an announcement by Tron’s founder, Justin Sun.
This is regarding a planned integration with the Solana blockchain. This development has led to optimism among investors, as the move is expected to enhance interoperability and attract new participants to the network.


TRX Market Performance and On-Chain Metrics
According to CoinMarketCap, Tron’s market cap is at $21.83 billion, a 2.83% increase in 24 hours. The 24-hour trading volume surged by 75.75% to $1.23 billion, indicating increased market activity.
TRX’s total and circulating supply remains at 95.01 billion tokens, with a volume-to-market cap ratio of 5.64%. Investor sentiment is largely bullish, with 82% of traders optimistic about TRX’s prospects, while 18% hold a bearish outlook.
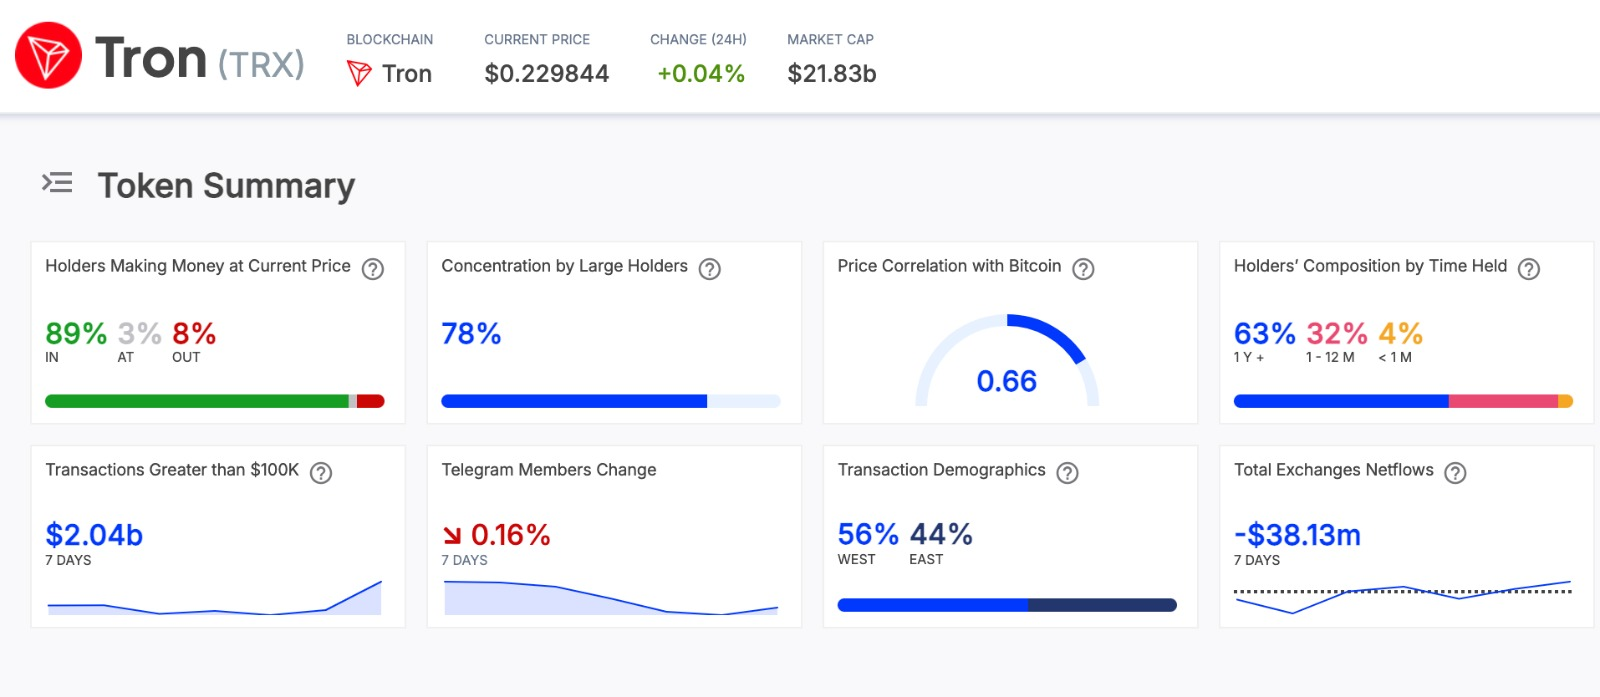
Data from IntoTheBlock shows that 89% of TRX holders are currently in profit, while 3% are at breakeven and 8% are at a loss. Large holders control 78% of the total supply, and TRX’s price maintains a 0.66 correlation with Bitcoin.
Technical Indicators and Market Trends
TRX is trading slightly below the 20-day simple moving average at $0.2317, which acts as a key resistance level.
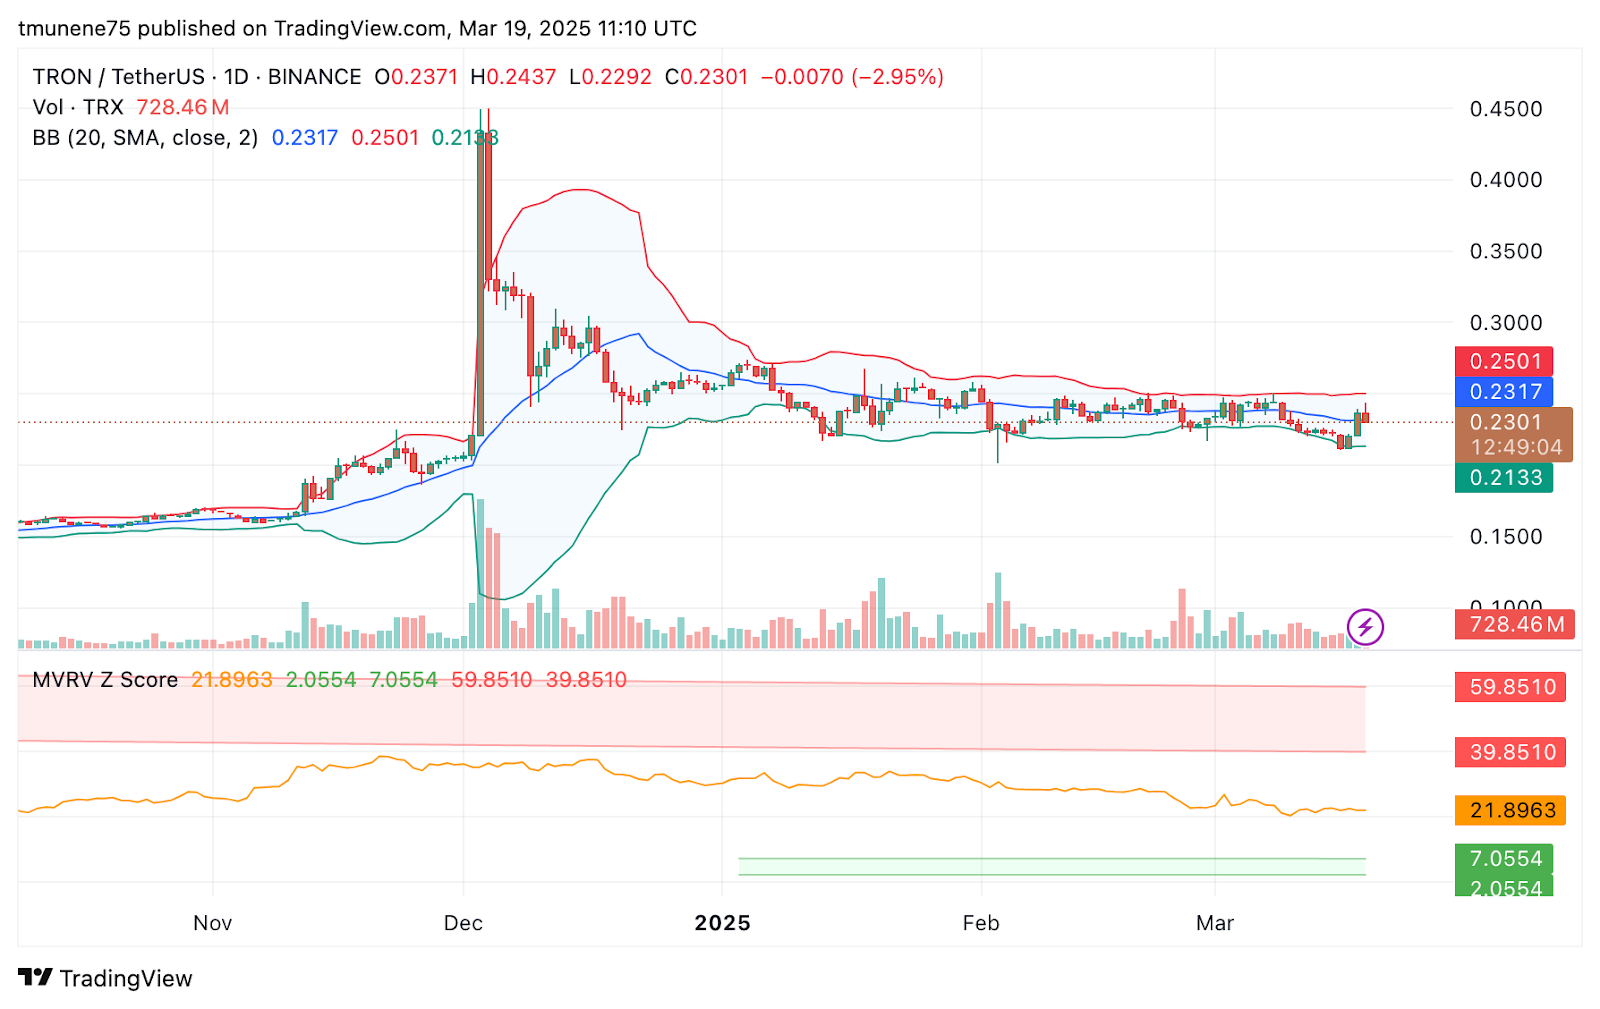
The upper Bollinger Band at $0.2501 shows the next hurdle for bullish momentum, while the lower band at $0.2133 acts as strong support. The Market Value to Realized Value Z-Score for TRX is 21.8963. While this indicates overvaluation, the figure is still below the extreme overvaluation level of 39.8510.
If the MVRV Z-Score continues to decline, TRX could face downward pressure. Meanwhile, large transactions exceeding $100,000 reached $2.04 billion in the past seven days, with a net outflow of $38.13 million from exchanges.
Key Price Levels and March 20 Prediction
TRX’s short-term price movement depends on its ability to maintain key support levels and break critical resistance zones. If TRX surpasses the $0.2317 resistance, it could push toward the upper Bollinger Band at $0.2501.
Sustained momentum above this level could drive prices to the $0.2700 – $0.2800 range. On the downside, failure to hold the $0.2292 support could lead to a decline toward $0.2133.
A further breakdown below this level might result in a deeper correction toward $0.2000 – $0.1900. For March 20, TRX could trade between $0.2500 and $0.2600 in a bullish scenario, while a bearish outcome may see prices drop to $0.2200 – $0.2130.


