- Alkimi’s partnerships signal growing industry trust in its blockchain solution.
- $ADS struggles with resistance at $0.106 but finds support near $0.102.
- RSI near oversold levels suggests a potential rebound for Alkimi’s price.
Alkimi ($ADS) has been making waves in the digital advertising sector, a market currently valued at $700 billion. According to analyst Michaël van de Poppe, Alkimi is poised for substantial growth due to its innovative approach and experienced team.
The project aims to improve business quality in the advertising space by offering a blockchain-based solution. Moreover, its recent partnerships with major corporations such as Coca-Cola, Dell, and Polestar demonstrate increasing industry adoption and confidence in its technology.


The fundamental growth on $ADS is massive.
— Michaël van de Poppe (@CryptoMichNL) March 18, 2025
The market size of digital advertising is $700B and the team has a long experience in this particular market.
That's why they've build a solution that improves the quality of business in the advertising space and you can benefit from… pic.twitter.com/nZ4vrue4oc
Market Performance and Price Trend Analysis
Over the past 24 hours, $ADS has experienced a decline, with its price currently at $0.1038, marking a 1.99% decrease. The price initially hovered around $0.106 before trending downward. Despite occasional recoveries, the overall trajectory remains bearish.
The lowest price point observed was $0.102, followed by a slight rebound. Notably, trading volume surged by 125.54%, reaching $59.88K. This sharp increase in activity suggests strong market engagement despite the downward price movement.
Key Support and Resistance Levels
Price action analysis highlights critical resistance and support levels. The price has struggled to break past the $0.106 resistance, encountering rejection multiple times. A secondary resistance level at $0.105 also posed a barrier before the price started to drop.
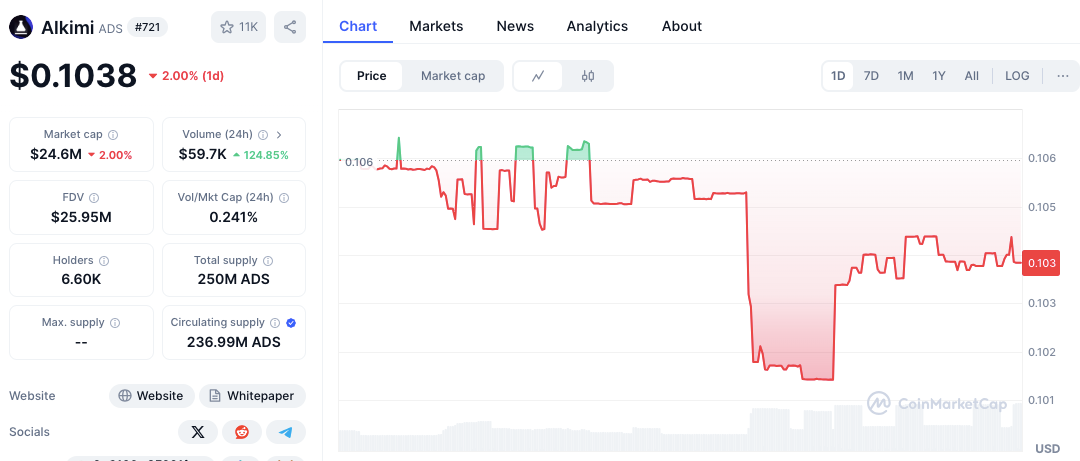
Conversely, the $0.102 mark has served as a temporary support level, preventing further declines. Another notable support level at $0.103 has facilitated price consolidation, potentially setting the stage for a reversal.
Technical Indicators Analysis
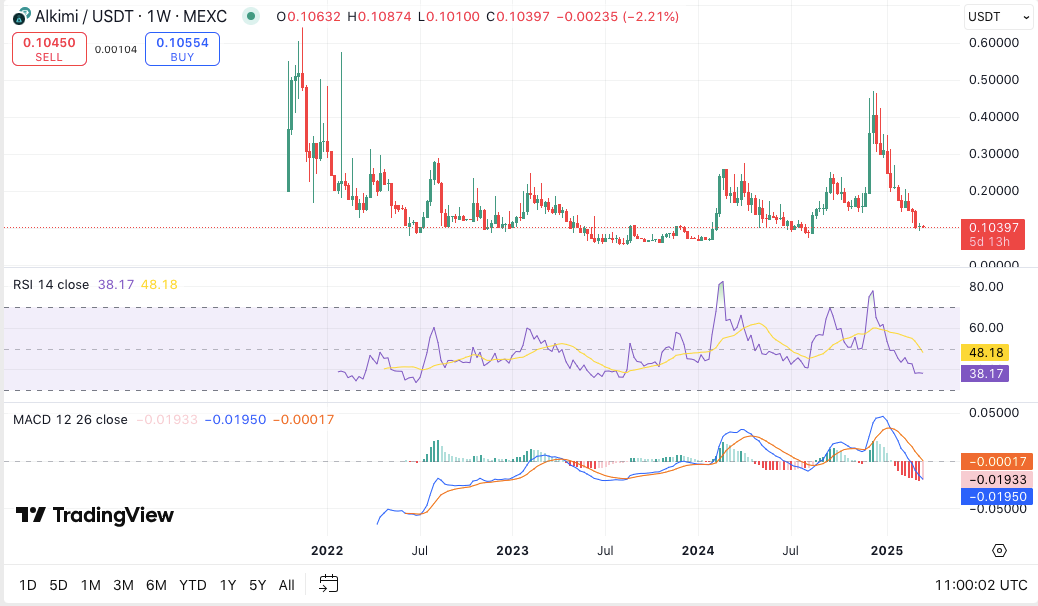
The Relative Strength Index (RSI) currently stands at 38.17, positioning it near the oversold territory. Typically, an RSI below 40 indicates bearish momentum, though it also signals a potential rebound.
If the RSI drops further below 30, it would enter extreme oversold conditions, increasing the likelihood of a trend reversal. Investors monitoring RSI movements may find an opportunity to enter at lower levels before a price recovery.
Momentum indicators further confirm the prevailing bearish trend. The MACD line is currently at -0.01933, positioned below the signal line at -0.00017. This bearish crossover, combined with negative histogram bars, indicates a continuation of downward pressure. However, if the MACD line starts to flatten, it could signal an upcoming reversal, providing an opportunity for buyers to regain control.


