
- Bitcoin eyes CPI data as key support and resistance levels shape market moves.
- Altcoins show mixed trends while Bitcoin dominance remains strong amid volatility.
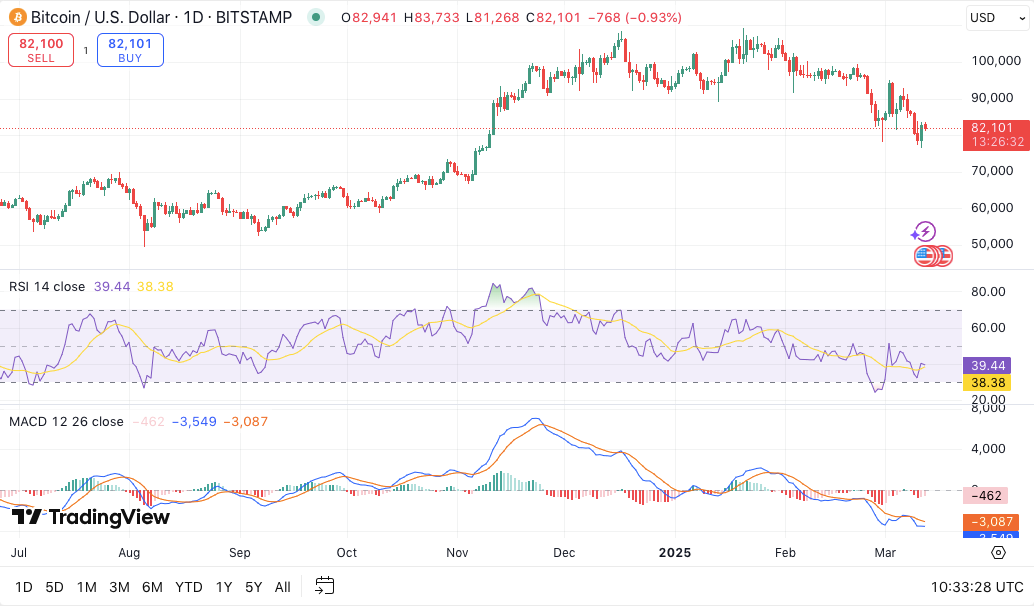
- RSI nears oversold, hinting at potential BTC rebound despite bearish MACD signals.
The cryptocurrency market is closely watching the release of the U.S. Consumer Price Index (CPI) data, which is expected to influence Bitcoin and other digital assets. As highlighted by Crypto Patel, an analyst, investors anticipate inflation figures to decline from 3.0% to 2.9% year-over-year, signaling potential shifts in Federal Reserve policies.
Lower-than-expected CPI could boost risk assets, including cryptocurrencies, while a higher figure might trigger a market downturn. With Bitcoin currently hovering around $82,404.55 after a recent 5% recovery, traders are assessing the potential price direction ahead of the CPI announcement.


🚨 U.S. CPI Data Incoming! 🚨
— Crypto Patel (@CryptoPatel) March 12, 2025
Markets are watching closely as CPI is expected to drop from 3.0% → 2.9% YoY 📉.
🔹 If inflation meets or drops below expectations → Bullish for stocks & crypto 🟢🚀
🔹 Higher-than-expected CPI → Bearish reaction likely 🔴📉
A lower CPI could… pic.twitter.com/HKiWhkGMdo
Market Sentiment and Bitcoin’s Performance
Bitcoin has shown resilience despite recent price corrections, with a slight upward movement in the past 24 hours. The cryptocurrency market capitalization stands at $2.64 trillion, marking a 0.91% increase.
However, volatility remains high as investors digest economic indicators and broader macroeconomic trends. A favorable CPI outcome could enhance market sentiment, potentially driving Bitcoin past key resistance levels. Conversely, an inflation spike could lead to further declines, reinforcing bearish trends.
Technical Analysis: Key Levels and Indicators
Bitcoin’s price action suggests a mix of bullish and bearish signals. The short-term trend remains uncertain following a pullback from recent highs. However, historical data shows Bitcoin maintaining a long-term bullish trajectory.
Key support levels include $80,000, $75,000-$77,000, and $70,000, with these zones acting as potential areas where buying pressure might emerge. On the upside, resistance is anticipated at $85,000-$87,000, followed by $90,000 and the psychological $100,000 mark.
Technical indicators present a mixed outlook. The Relative Strength Index (RSI) is at 39.84, approaching oversold conditions. This could suggest an impending bounce or a consolidation phase. Meanwhile, the Moving Average Convergence Divergence (MACD) remains in bearish territory, indicating continued downward momentum unless bullish catalysts emerge.
Altcoin Performance and Market Trends
Ethereum (ETH) has seen a 1.72% decline, trading at $1,888.43. Binance Coin (BNB) also recorded a slight drop of 0.78%, settling at $558.55. Solana (SOL) is down by 0.06%, trading at $124.03, whereas XRP has gained 2.51%, reaching $2.1928. Despite Bitcoin’s dominance, altcoins are showing mixed performances, with some exhibiting relative strength against BTC.
The Fear and Greed Index currently stands at 19, indicating extreme fear among investors. The Altcoin Season Index is at 13, reinforcing that the market is in a Bitcoin-dominant phase.


