
- XRP trades at $2.36, down 4.94%, with a market cap of $137.55B and a 12.97% drop in trading volume, indicating cautious market sentiment.
- Technical indicators show weak momentum; RSI Divergence Indicator at 46.36 and MACD hint at a possible bullish reversal if XRP breaks above $2.50.
- Analysts predict a 23% breakout; bullish targets at $2.80–$3.00, while bearish trends could test support at $2.15–$2.00.
The crypto market faced increased volatility following the historic Crypto Summit at the White House on March 7, 2025. The event led to mixed reactions, with XRP showing signs of decline.
Analysts raised concerns over former President Donald Trump’s executive order on Bitcoin’s strategic reserve, questioning its broader impact on the market. XRP’s price reacted to these developments with sideways price movements.


XRP’s Market Performance and Key Metrics
On March 8, At the time of publication, XRP was trading at $2.36, a 4.94% decline in the last 24 hours. However, it remains up by 9.22% over the past seven days, though it has a 3.36% monthly drop.
XRP’s market cap is at $137.55 billion, down by 4.82%, with a 24 hour trading volume of $7.67 billion, a 12.97% decrease. The fully diluted valuation reached $236.97 billion, while the circulating supply is 58.04 billion XRP out of a total 99.98 billion.
XRP is in a consolidation phase, trading between $2.30 and $2.50. It recorded a daily high of $2.4106 and a low of $2.3274, suggesting moderate trading activity. The volume-to-market cap ratio is at 5.58%, indicating stable but cautious activity from traders.
Technical Indicators and Market Trends
The RSI Divergence Indicator for XRP is at 46.36, sitting below the neutral 50 mark. The indicator shows weak momentum, neither strongly overbought nor oversold.
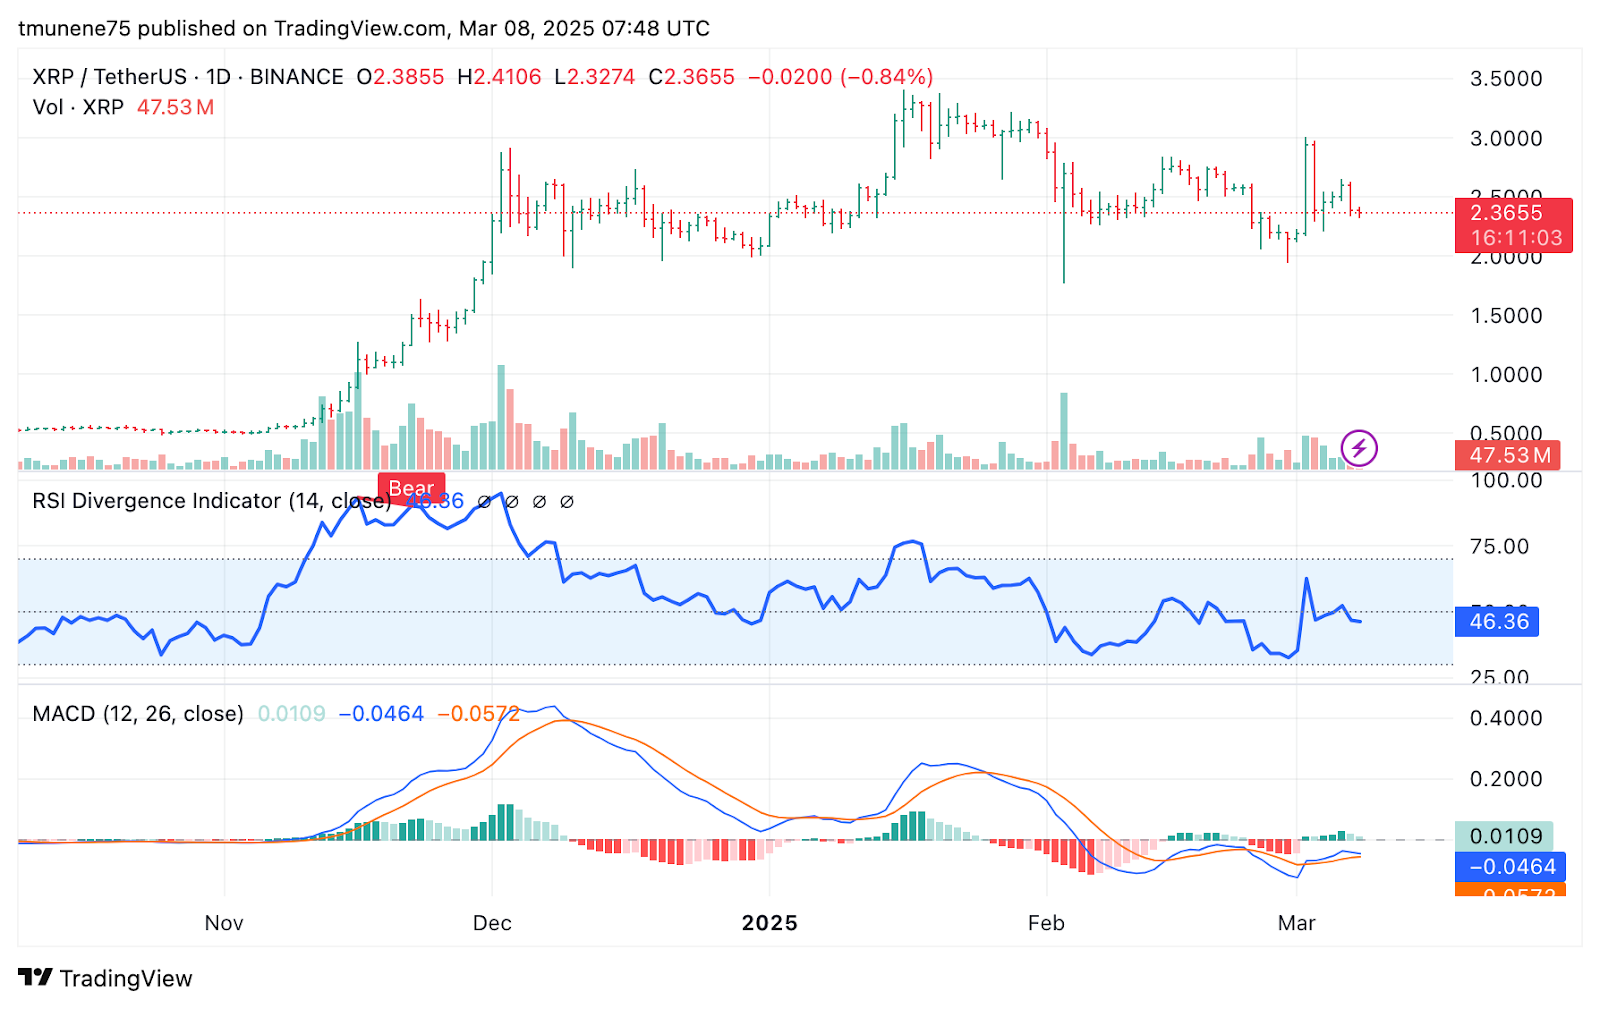
In November, a bearish divergence occurred when XRP was overbought, leading to a price correction. If the indicator moves above 50, it could indicate a potential uptrend. A drop below 40, however, might suggest further downside pressure.
The MACD shows early signs of a possible bullish reversal. The MACD line is at -0.0464, slightly below the signal line at -0.0572. A positive histogram reading of 0.0109 suggests the initial stages of a trend shift.
If the MACD line crosses above the signal line, it could confirm a bullish breakout. XRP previously surged past $3.00 before entering a corrective phase. It now consolidates within the $2.30–$2.50 range, suggesting indecision in market sentiment.
If bullish momentum increases, XRP could break above $2.50 and test the $2.80–$3.00 resistance. On the downside, if it falls below $2.30, support levels at $2.15–$2.00 might occur.
Analysts’ Projections and Market Outlook
According to Egrag Crypto, XRP’s price action could align with historical trends, targeting high long term levels.
He highlighted two projections: a midpoint breakout target of $9.7 and a potential rally toward $27 based on the 2017-2018 cycle’s 718% gain. If history repeats, XRP could reach these levels in an extended bullish run.
Analyst Ali noted that XRP is consolidating within a symmetrical triangle pattern. A breakout from this pattern could lead to a 23% price movement in either direction, depending on market developments.
If bullish momentum prevails, a push toward $2.70–$2.80 remains likely. However, if bears gain control, XRP could retest support at $2.15–$2.00. XRP’s movement on March 9 will depend on whether it sustains support above $2.30 or breaks past resistance at $2.50.


