
- Ethereum’s $1.8B outflow signals investor confidence despite bearish market trends.
- ETH consolidates in a descending triangle, eyeing a breakout above $2,200.
- RSI near oversold levels hints at a potential relief rally for Ethereum soon.
Ethereum (ETH) is witnessing significant movement as $1.8 billion worth of the asset left exchanges last week, marking the highest weekly outflow since December 2022. Despite prevailing market pessimism surrounding Ether’s price, this trend signals growing confidence among investors.
Large-scale withdrawal often indicates that holders are moving ETH to private wallets, potentially reducing sell pressure on exchanges. This development comes amid ongoing consolidation within a descending triangle pattern, suggesting an imminent breakout in either direction.


$1.8 billion worth of $ETH left exchanges last week, the highest weekly amount since December 2022.
— IntoTheBlock (@intotheblock) March 10, 2025
Despite ongoing pessimism around Ether prices, this trend suggests many holders see current levels as a strategic buying opportunity. pic.twitter.com/ti4Vxka7LV
Massive Ethereum Withdrawals Reflect Investor Confidence
According to crypto analyst Ali Martinez, over 600,000 ETH were withdrawn from exchanges in the past week. This substantial movement signifies a shift in market sentiment, as large outflows generally indicate accumulation.
Reduced supply on exchanges can lead to price appreciation if demand remains steady or increases. Despite Ethereum’s recent price struggles, this trend suggests that many traders see the current price level as a strategic buying opportunity.
Over 600,000 #Ethereum $ETH have been withdrawn from crypto exchanges in the past week! pic.twitter.com/oPmLi4lxTw
— Ali (@ali_charts) March 10, 2025
Descending Triangle Indicates Potential Breakout
Ethereum’s price has been consolidating within a descending triangle, marked by lower highs and stable support. Since March 3, ETH has declined from around $2,150 to approximately $2,025 as of March 9.
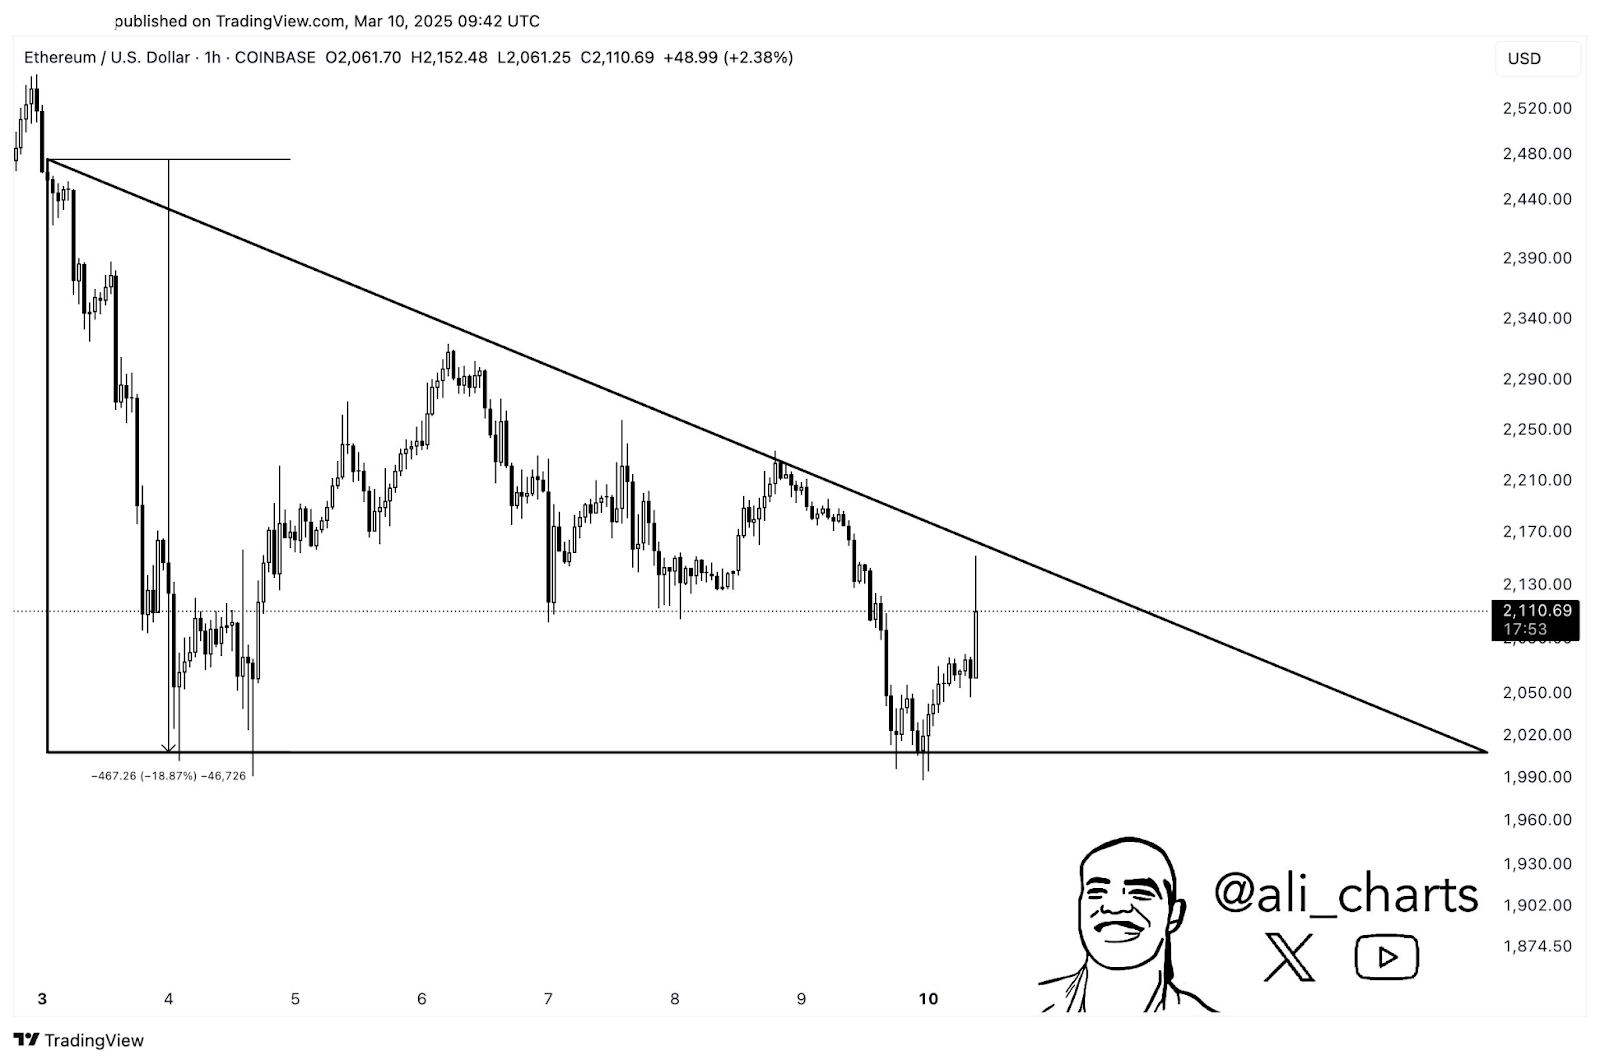
Historically, descending triangles often precede significant price movements once a breakout occurs. If ETH breaks above the resistance level of $2,200, analysts predict an 18% rally.
Conversely, a breakdown below $2,000 support could lead to further downside. Traders should monitor price action closely, as volume confirmation will play a crucial role in determining the next trend.
Declining Exchange Reserves and Market Implications
Besides price consolidation, Ethereum’s exchange reserves have also declined. A lower reserve balance generally implies reduced immediate selling pressure, which can support price stability or even upward movement. A consistent decrease in exchange reserves aligns with bullish sentiment, as it suggests holders are opting for long-term storage rather than short-term selling.
Ethereum Price Performance and Key Technical Indicators
As of press time, Ethereum is trading at $2,085.21 with a 24-hour trading volume of $25.27 billion. Over the past 24 hours, ETH has declined by 2.84%, and over the last seven days, it has dropped by 11.16%. With a circulating supply of 120 million ETH, its market capitalization stands at approximately $251.28 billion.
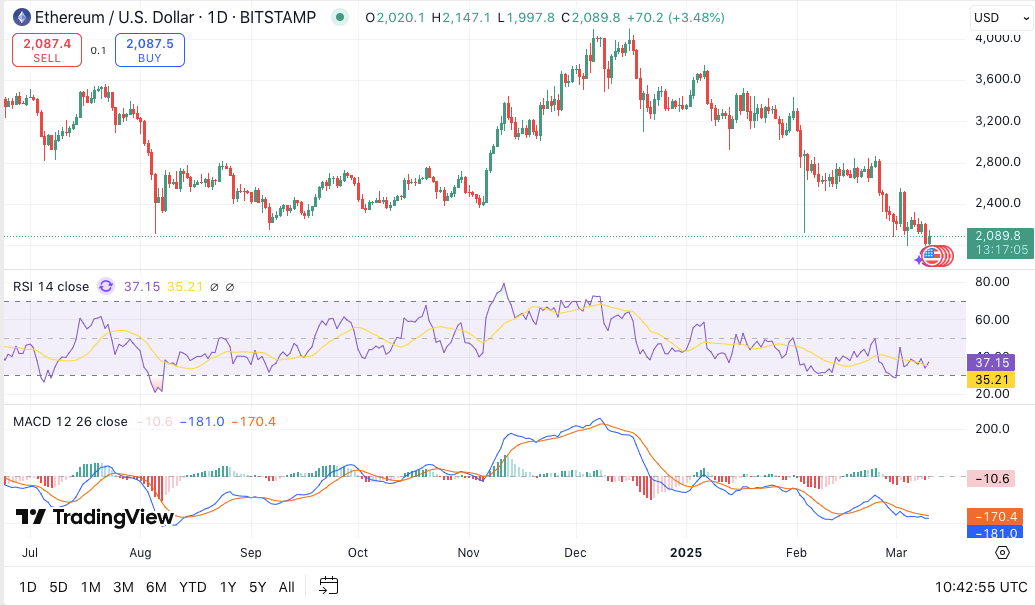
Technical indicators provide further insight into Ethereum’s potential price movement. The Relative Strength Index (RSI) is currently at 36.63, nearing the oversold zone. This suggests that Ethereum could be approaching a relief rally.
The Moving Average Convergence Divergence (MACD) histogram shows a decrease in negative momentum, hinting at a possible reversal. If the MACD line crosses above the signal line, Ethereum may see bullish momentum in the near term.


