
- Solana’s $510M transfer raises concerns over potential sell pressure on SOL.
- SOL must hold $160 support to sustain bullish momentum toward $170-$175.
- MACD signals bearish momentum, but convergence hints at a possible trend shift.
Solana (SOL) has drawn significant attention after a massive transfer of 3,001,434 SOL, valued at approximately $510 million, was moved from an unknown wallet to Binance. This transaction raises concerns about potential sell pressure that could impact the price.
Despite this, SOL has surged 13.23% in the last 24 hours, currently trading at $163.62. Market capitalization has climbed 14.15% to reach $83.06 billion, while 24-hour trading volume has skyrocketed by 367.03% to $12.58 billion. The current trend shows a strong breakout from $144, followed by a rally above $180 before pulling back.


Support and Resistance Levels to Watch
Solana’s price action indicates critical support at $144, a level that previously acted as the foundation for the recent uptrend. A decline below this could signal extended bearish pressure.

Additionally, $160 serves as a psychological support level, where the price is currently consolidating. Maintaining above this threshold could reinforce bullish sentiment. If SOL experiences further retracement, the $150-$155 zone may act as a strong demand area, preventing deeper declines.
On the upside, resistance lies between $170 and $175, a range where the price briefly touched before pulling back. Breaking above this region could reignite buying pressure.
Furthermore, $180 represents a major resistance level, where the rally peaked before reversing. A decisive breakout beyond this point could pave the way for a push toward the $190-$200 range, marking a key psychological barrier.
Technical Indicators Suggest a Cautious Approach
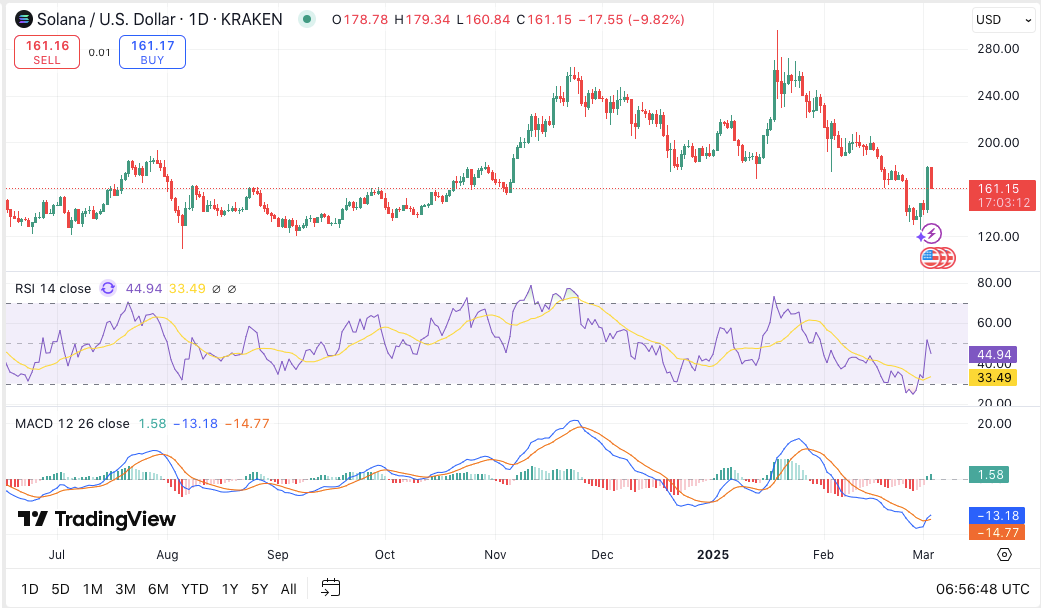
The Relative Strength Index (RSI) currently sits at 45.72, indicating neutral to bearish momentum. A move above 50 could signal renewed buying interest.
Meanwhile, the MACD (Moving Average Convergence Divergence) remains in bearish territory, with the MACD line at 1.73 and the signal line at -13.00. The histogram reading of -14.73 suggests bearish momentum, although signs of convergence hint at a potential shift in trend.


