
- Bittensor (TAO) struggles to hold $300 as selling pressure remains strong.
- RSI near oversold levels suggests a potential rebound if buying interest rises.
- MACD confirms bearish momentum, with negative histogram bars reinforcing the trend.
Bittensor (TAO) has experienced a sharp decline, shedding 16.31% of its value in the past 24 hours. The price now stands at $306.09, reflecting bearish momentum. The market capitalization has also dropped by 16.24%, signaling a widespread sell-off.
Additionally, trading volume has decreased by 12.51%, indicating lower participation from traders. This combination of factors suggests that market sentiment remains weak, with investors adopting a cautious approach.


Resistance and Support Levels Define the Next Moves
Bittensor (TAO) recently failed to sustain its position near $364.37, a key resistance level. This zone has acted as a reversal point, leading to the current downtrend. If the price regains momentum, the $360–$365 range will likely serve as the next resistance area. A strong breakout above this level could shift sentiment toward a more bullish outlook.
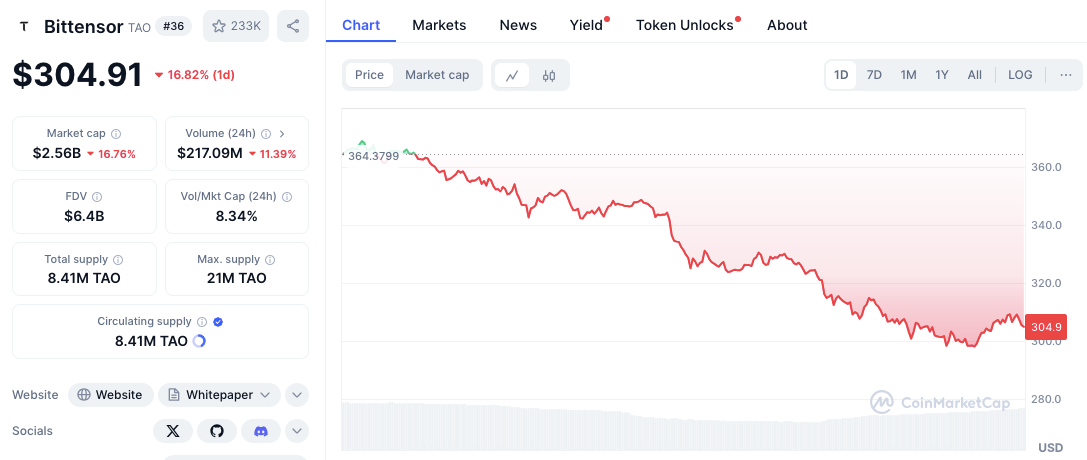
On the downside, the $300 mark plays a crucial role as psychological support. The price is currently hovering slightly above this zone. If selling pressure persists, the next significant support range lies between $280 and $290. Buyers may step in at this level to prevent further downside movement. Hence, the ability to hold above $300 will be critical in determining the next price direction.
Technical Indicators Suggest Continued Bearish Momentum
Bittensor’s price action remains under bearish control as it continues forming lower highs and lower lows. The declining trading volume further emphasizes the lack of strong buying interest, despite the recent sell-off. However, lower volume could also indicate that selling pressure is losing intensity, potentially setting the stage for a stabilization phase.
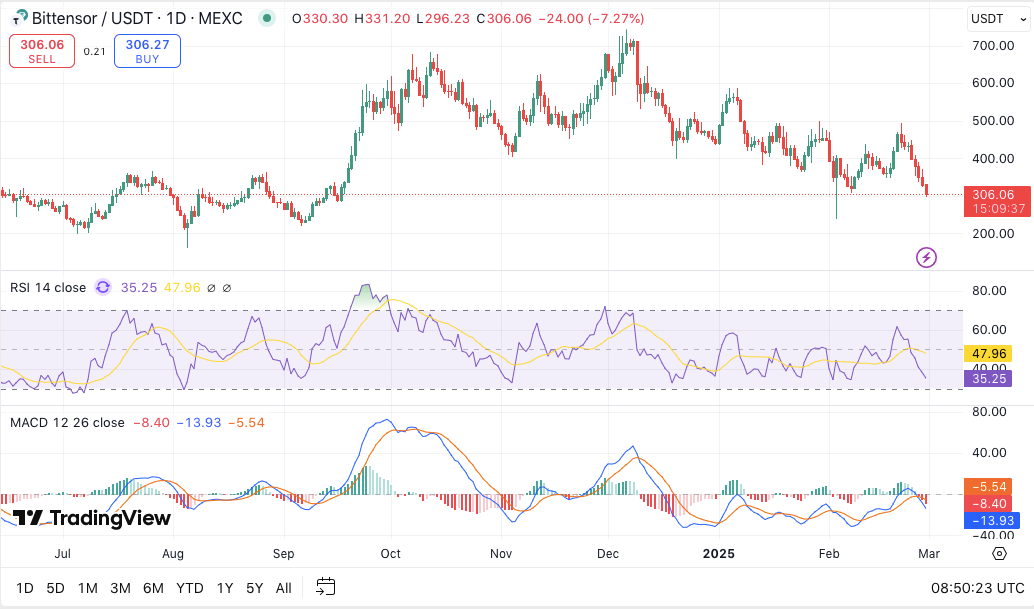
The Relative Strength Index (RSI) currently sits at 35.52, which is close to oversold territory. If buying pressure increases, a rebound could materialize. Moreover, the Moving Average Convergence Divergence (MACD) confirms a bearish outlook.
The MACD line stands at -8.25, positioned below the signal line at -5.50. Negative histogram bars suggest growing bearish momentum, reinforcing the ongoing downtrend.


