
- TRON’s active addresses surged 57%, from 1.63M to 2.57M, boosting its dominance in altcoin transactions, led by USDT transfers.
- USDT supply on TRON hit a record 4B, highlighting strong liquidity growth and increasing its role in the crypto market.
- TRX faces resistance at $0.26–$0.35; holding $0.20 support is crucial. A breakout may hit $0.35, while failure could drop TRX to $0.18.
TRON (TRX) has seen a sharp increase in network activity, with active addresses rising by 57% in the past month. According to analyst Ali, the number of active addresses surged from 1.63 million to 2.57 million.
#TRON $TRX network activity has increased by 57% over the past month, rising from 1.63 million active addresses to 2.57 million today! pic.twitter.com/7dEdn90rli
— Ali (@ali_charts) February 27, 2025
This growth aligns with TRON’s dominance in altcoin transactions, as CryptoQuant reports that TRON holds a 41.6% share, driven by USDT transfers and DeFi expansion. The network’s deep integration into the crypto market is evident, with USDT supply on TRON reaching an all time high of 4 billion.


TRON’s Network Expansion and USDT Growth
TRON is dominating altcoin transactions, maintaining a steady share of around 40% in recent months. CryptoQuant notes that its transaction volume has surged due to increasing USDT activity. Most transactions on the TRON blockchain stem from USDT transfers.
TRON's USDT supply has reached an all-time high
— CryptoQuant.com (@cryptoquant_com) February 27, 2025
“In 2020, this volume fluctuated between 50 million and 500 million, but today it is around 4 billion, confirming TRON's deep integration within the broader crypto ecosystem.” – By @Darkfost_Coc
Link ⤵️https://t.co/PLzOvZ2fiV pic.twitter.com/3I5JrInsAb
The USDT supply on TRON has reached a record high, indicating greater liquidity moving onto the network. CryptoQuant shows that in 2020, USDT volume fluctuated between 50 million and 500 million. Today, it has grown to nearly 4 billion, underscoring TRON’s expanding footprint within the crypto market.
On-chain data further reveals that TRON’s transaction volume has consistently outpaced centralized exchanges (CeX) since 2020. The current on-chain volume is five times higher than that of CeX, showing TRON’s decentralized nature and increasing adoption.
TRX Market Performance and Indicators
TRX has had a strong rally but is undergoing a correction. At press time, TRX was trading at $0.2290, a 9.74% drop for the month.
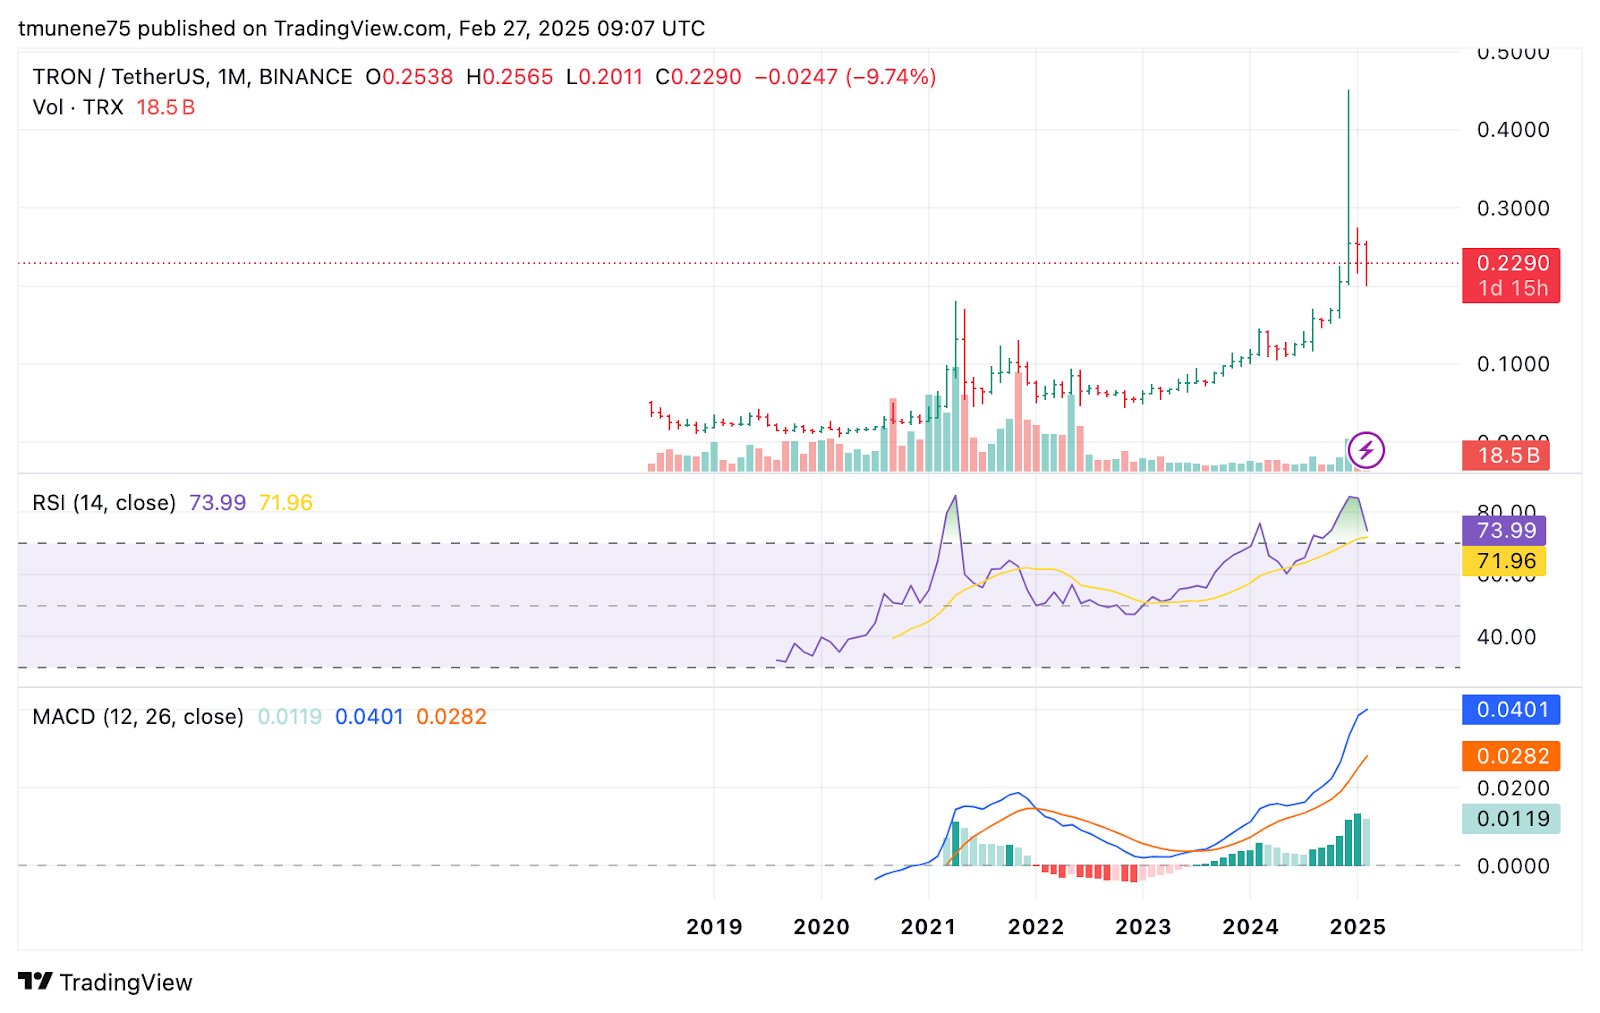
The price fluctuated between a high of $0.2565 and a low of $0.2011, showing volatility. TRX’s trading volume is strong at 18.5 billion, indicating high market activity. Technical indicators show mixed signals.
The RSI is at 73.99, with a moving average of 71.96, indicating overbought levels. This suggests potential selling pressure or short term consolidation. Meanwhile, the MACD is positive, with the MACD line at 0.0401, above the signal line at 0.0282.
A contracting histogram could hint at a possible slowdown. The asset faces resistance at $0.26, $0.30, and $0.35. Failure to hold above $0.26 led to a retracement. Support levels are at $0.20, $0.18, and $0.15, which could determine TRX’s short term movement.
TRX March 2025 Price Projection
TRX’s price movement will depend on its ability to hold support levels and maintain investor confidence. If bullish momentum resumes, a potential breakout toward $0.30–$0.35 could occur. However, if TRX breaks below $0.20, a decline to $0.18 or lower may follow before any recovery.


