
- Ethereum struggles below key resistance, risking a drop toward $1,800 if selling persists.
- A breakout above $3,000 could fuel a rally toward $4,093 and its 2021 all-time high.
- Bearish indicators signal weakness, but RSI near oversold could trigger a relief bounce.
Ethereum (ETH) is showing signs of weakness, with analysts warning of a potential breakdown if key support levels fail to hold. CryptoBusy, a market analyst, notes that ETH is forming a double top pattern, a bearish signal that could lead to further downside movement.
The 0.618 Fibonacci retracement level, which serves as the neckline of this pattern, stands as the final line of defense. If Ethereum breaks below this level, another leg downward may follow.


🚨 $ETH IS BREAKING DOWN FROM A MAJOR SUPPORT!
— CryptoBusy (@CryptoBusy) February 25, 2025
Currently forming a double top pattern.
The 0.618 level stands as the last line of defense, the neckline of this formation.… pic.twitter.com/U4s1XkxjF2
ETH Price Action and Key Levels to Watch
CryptoCapo, another analyst, highlights important support and resistance levels that will determine Ethereum’s next move. The primary resistance zone lies between $2,800 and $3,000.
A successful breakout above this range could indicate bullish momentum, potentially pushing ETH toward $4,093 and even its 2021 all-time high (ATH) of $4,867. However, this area is likely to face selling pressure, making a sustained rally uncertain.
On the downside, Ethereum has strong support between $1,800 and $2,100. If selling pressure increases, the price could revisit this zone before attempting a recovery. The $3,000 level, acting as a mid-range level, could serve as both support and resistance depending on market sentiment.
Potential Scenarios for Ethereum’s Price Movement
Ethereum’s price trajectory remains uncertain as it consolidates between the $2,800–$3,000 resistance and the $1,800–$2,100 support. If ETH fails to break above $3,000, it may decline toward its lower support range before reversing higher. However, if it manages to hold above $3,000, a strong uptrend could begin, leading to a broader altcoin rally.
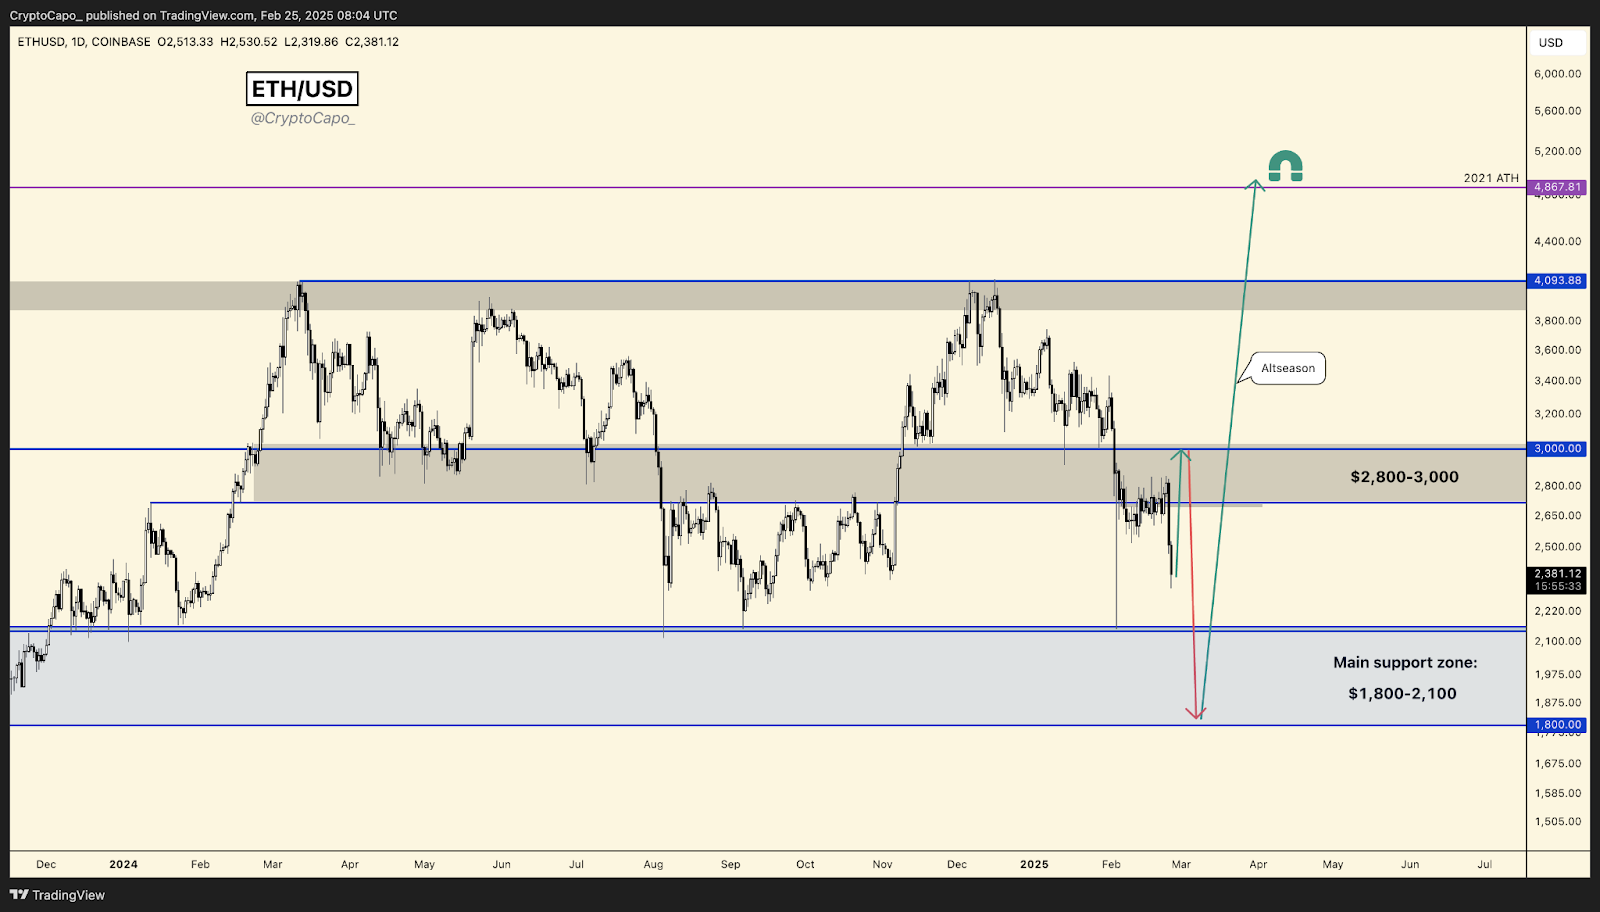
A bullish breakout could propel ETH toward $4,093, and if momentum persists, it may eventually test its 2021 ATH. On the other hand, a rejection at $3,000 might trigger another dip toward $1,800, creating an opportunity for buyers to step in before a potential reversal. If consolidation continues, ETH could trade sideways within its current range until a decisive move occurs.
Market Outlook Amid Declining Price Action
Ethereum’s price has dropped significantly, currently trading at $2,370.05. Over the past 24 hours, ETH has declined by 11.80%, while the seven-day loss stands at 12.34%. Its market capitalization now sits at $286 billion, with a 24-hour trading volume of over $40 billion.
Technical Indicators Signal Bearish Momentum
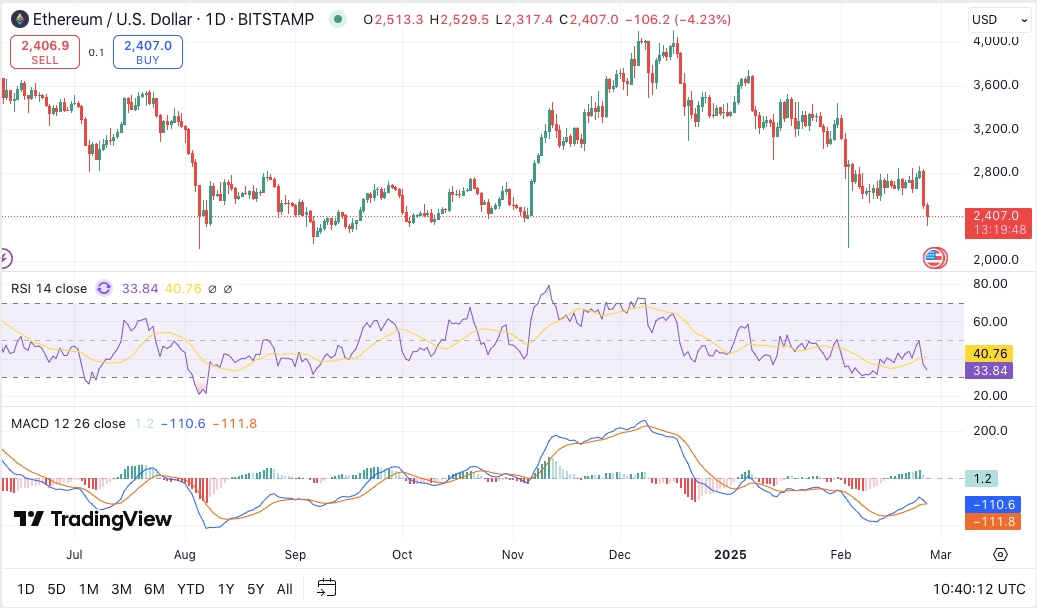
Ethereum’s technical indicators suggest further downside risks. The Relative Strength Index (RSI) is currently at 33.52, approaching the oversold zone. If it dips below 30, selling pressure may exhaust, potentially leading to a relief bounce. However, RSI must rise above 40 to confirm a recovery.
The Moving Average Convergence Divergence (MACD) indicator also presents a bearish outlook. The histogram remains negative, and the signal line continues its downward trend. A bullish crossover is necessary to indicate a reversal, but for now, momentum remains weak.


