
- SOL faces intense selling pressure, testing key support at $130 amid volatility.
- Bearish indicators suggest further downside unless buying momentum strengthens.
- Resistance at $140 and $150 must break for SOL to regain bullish traction.
Solana (SOL) has faced intense downward pressure, plunging 50% in a month. The cryptocurrency is trading at $135.37, marking a 15.28% decline in the past 24 hours and a 17.59% drop over the past week. This significant downturn has slashed its market capitalization to approximately $67 billion, signaling widespread selling activity.
The daily trading volume surged 216.45% to $11.55 billion, highlighting heightened market volatility. Investors are closely monitoring key support and resistance levels as SOL struggles to stabilize. The technical outlook suggests further downside risks unless buying momentum strengthens.


Sharp Decline Raises Concerns
SOL’s recent downtrend has intensified, with the price sliding from a daily high of $160.07 to current levels. This sharp fall reflects increased selling pressure, with investors offloading positions amid broader market weakness.

The market capitalization has also dropped 14.89%, further underscoring the bearish sentiment. The volume spike suggests heightened trading activity, indicating that traders are reacting strongly to recent price movements. If selling continues, the cryptocurrency could test lower support zones in the coming days.
Key Support and Resistance Levels
SOL is approaching critical price levels that could determine its short-term trajectory. The immediate support stands at $130, a key psychological level. If this fails to hold, the next downside targets are between $125 and $128, followed by a stronger support zone at $120. A break below these levels could accelerate losses.
On the upside, resistance remains firm at $140, where selling activity has been prominent. Further resistance lies in the $150 to $155 range, an area that has previously triggered rejections. The recent high of $160 remains a major resistance level, and SOL must reclaim this zone for a sustained recovery.
Technical Indicators Suggest Bearish Momentum
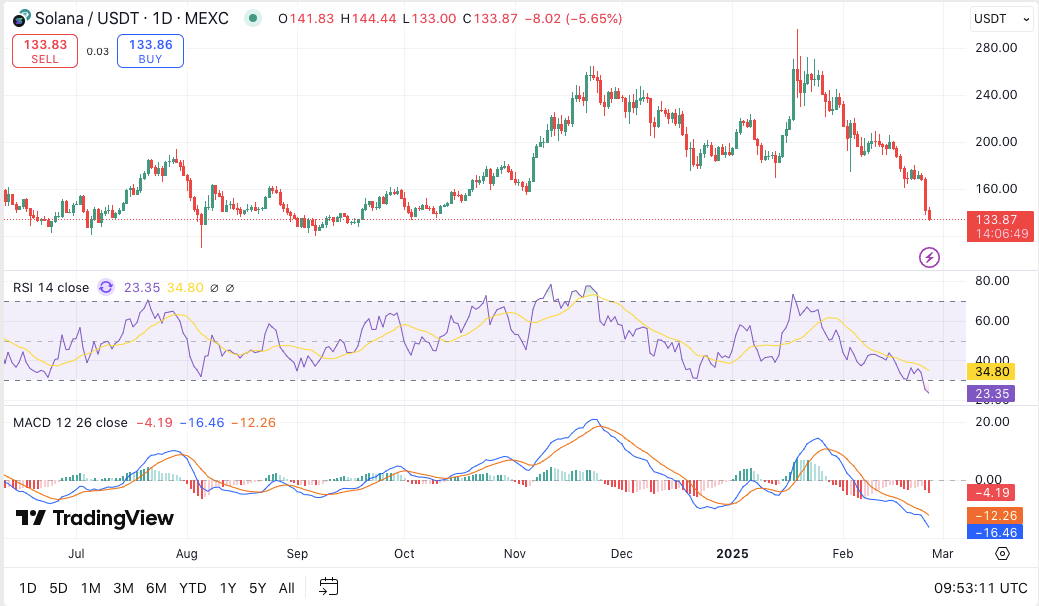
The Relative Strength Index (RSI) currently stands at 23.73, placing SOL in the oversold territory. Historically, such conditions indicate a potential for a short-term rebound, but a lack of strong buying pressure could lead to further declines.
Additionally, the Moving Average Convergence Divergence (MACD) indicator remains deeply negative. The MACD line at -16.32 is below the signal line at -12.24, with a bearish histogram reading of -4.09. These indicators confirm strong downward momentum, with no immediate signs of a bullish reversal.


