
- TRUMP faces resistance at $16.50, with $16.00 acting as a crucial support level.
- Rising trading volume signals volatility, but weak momentum keeps the trend bearish.
- MACD hints at a possible reversal, but open interest decline suggests caution.
OFFICIAL TRUMP (TRUMP) is currently trading at $16.31, reflecting a 3.68% decline in the past 24 hours. The cryptocurrency witnessed fluctuations, with an initial price movement around $16.99 before experiencing a sharp drop below $16.00.
Although a minor recovery followed, the asset remains in a downtrend. Market participants are closely monitoring support and resistance levels to gauge the next move. With trading volume up by 11.92% and increased volatility, traders anticipate potential price shifts based on key indicators.


Price Movements and Trend Analysis
TRUMP initially attempted to rise from $16.99 but faced selling pressure, leading to a downward correction. The decline pushed the asset below $16.00 before finding temporary stability. Buyers attempted to regain control, driving the price toward $16.32. However, the overall market sentiment remains bearish.
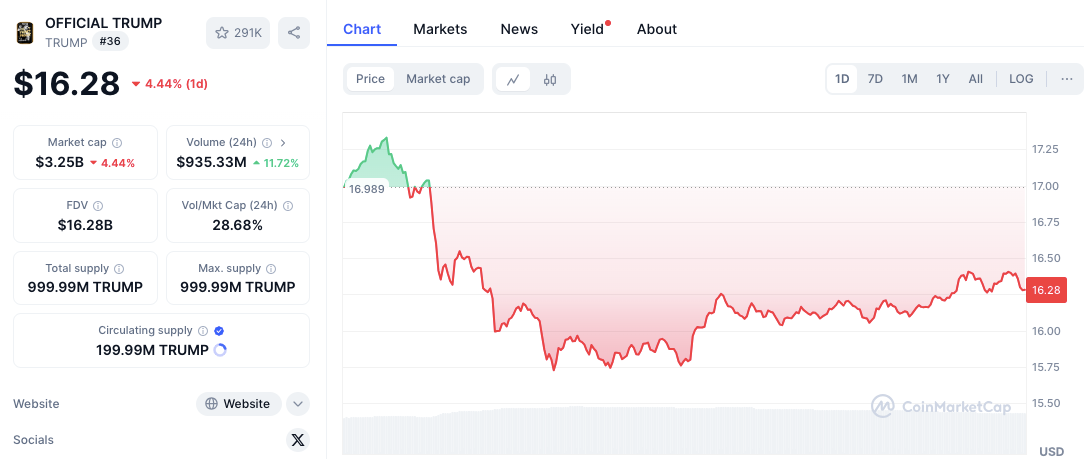
Despite efforts to recover, the asset struggles to break out of its downward trajectory. Increased trading activity suggests that market participants are reacting to the latest price fluctuations, which could fuel further volatility.
Key Support and Resistance Levels
The immediate support stands at $16.00, where buyers previously prevented further losses. If this level fails to hold, the next major support lies at $15.75, signaling a deeper correction.
On the upside, resistance is observed at $16.50, a level where the price faced selling pressure during its recovery attempt. Beyond this, the $16.99-$17.00 range serves as a critical barrier, as past rejections in this zone triggered notable declines. A break above this level could indicate bullish momentum, while failure to sustain above $16.50 may keep the asset in a bearish phase.
Market Outlook and Technical Indicators
The market’s outlook remains uncertain, with potential price movement hinging on whether TRUMP holds above $16.00. A sustained position above this support may pave the way for a retest of $16.50 and possibly $16.99. Conversely, a breakdown below $16.00 could expose the price to further declines toward $15.75.
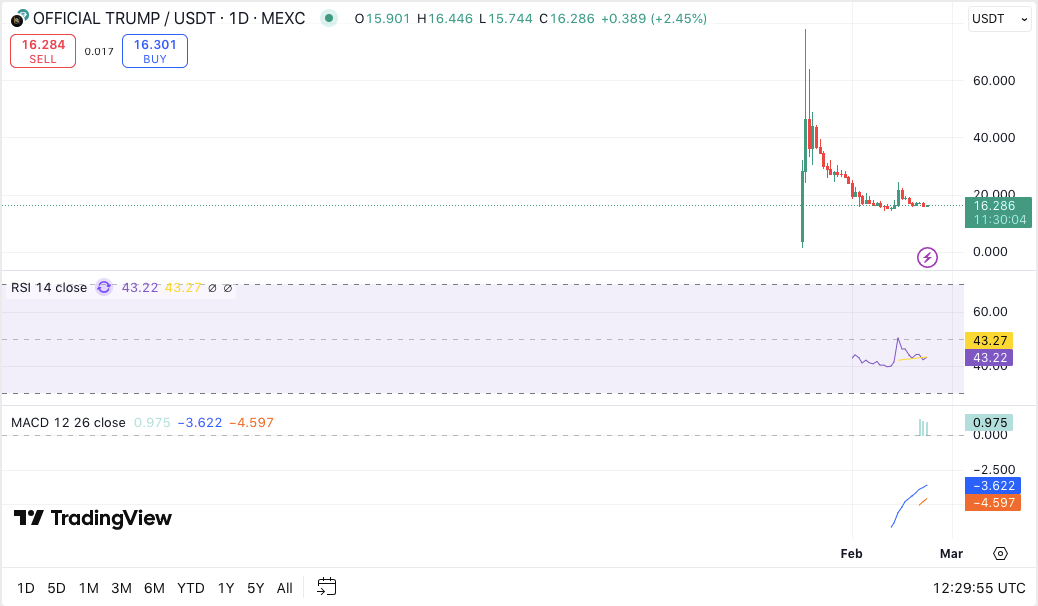
Technical indicators provide additional insights into the current trend. The Relative Strength Index (RSI) stands at 43.32, placing the asset in neutral territory. This reading suggests that the market is neither overbought nor oversold, though weak momentum persists.
The Moving Average Convergence Divergence (MACD) remains negative, with the MACD line at -3.618 and the signal line at -4.596. Although bearish sentiment prevails, a potential crossover could indicate a reversal if buyers step in.
Derivatives Market Activity and Impact
As per Coinglass data, TRUMP’s derivatives market data shows a 5.16% rise in trading volume, reaching $1.57 billion. This surge highlights increased participation and heightened activity. However, open interest declined by 13.95% to $445.88 million, suggesting reduced outstanding contracts. This drop could stem from liquidations or traders locking in profits.


