
- DOGE needs to maintain a price above $0.2353 to prevent further price reduction while the future major bounce point stands at $0.2607.
- The Fibonacci analysis shows three potential price targets which include $0.50 along with $1.00 and $2.77 if DOGE stays above $0.19-$0.16.
- The RSI and MACD suggest bearish trends yet a possible trend reversal may occur during rising buying pressure.
In a stunning decision, a federal judge has granted former President Donald Trump and the cryptocurrency Dogecoin (DOGE) the authority to abolish the United States Agency for International Development (USAID).While details remain unclear, Trump hailed the decision as a victory against government overreach, while Dogecoin’s price has declined amid speculation over its newfound legal influence
The current price of Dogecoin (DOGE) is $0.2445, reflecting a 4.8% decline, indicating a bearish sentiment in the market. In Bitcoin terms, DOGE is valued at 0.0002532 BTC, also showing a 2.8% drop. The 24-hour trading range spans from $0.2353 to $0.2607, highlighting moderate volatility within the day.


Fibonacci Analysis: Crucial Support and Bullish Targets
According to analyst Ali, Dogecoin (DOGE) Fibonacci retracement levels since 2015, has followed an overall upward trajectory, forming a well-defined ascending channel. The most notable rally occurred in 2021, where DOGE surged to an all-time high of approximately $0.50-$0.60 before undergoing a correction.
Multiple support levels exist between $0.19 and $0.16 because these values match the 0.5 and 0.618 Fibonacci retracement levels. A resistance level at $0.50 corresponds with the 1.0 Fibonacci level and would activate the next upward movement if DOGE maintains its position above $0.19 through $0.16. Several important price targets lie ahead starting at $1.00 and continuing up to $2.00 and possibly reaching $3.00 with the 1.618 Fibonacci level setting the price projection at $2.77.
Technical Indicators Hint a Bearish Signal with Possible Reversal
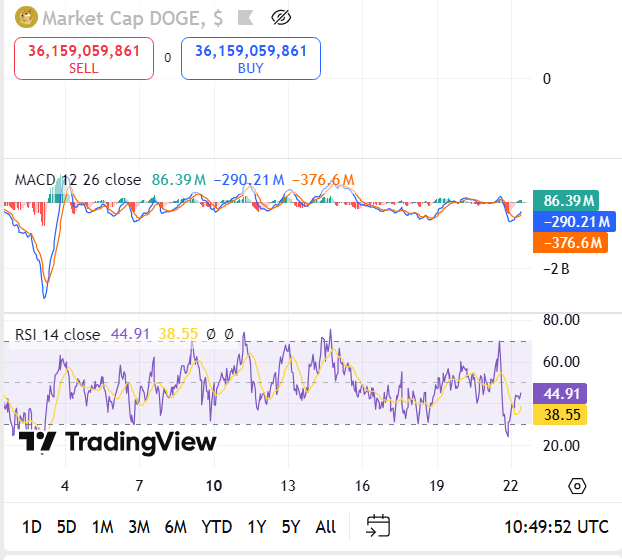
The MACD indicator presents a mixed outlook, with the MACD line at 86.11M, the signal line at -290.57M, and the histogram difference at -376.67M. The negative histogram indicates that the MACD line remains below the signal line, which generally suggests bearish momentum in the market. However, the MACD line being positive hints at a possible upcoming shift in trend if buying pressure increases.
The RSI stands at 44.82, with its signal line at 38.54 indicating bearish momentum, this reading suggests that DOGE is experiencing weak demand but is not in the oversold zone yet.
DOGE Key Levels To Watch and Outlook
The price of DOGE could potentially experience a reversal if it manages to maintain its support at $0.2353 and could then move toward $0.26 and above. An increase past $0.2607 serves as a trigger for a more powerful bullish rally targeting between $0.27 and $0.28. A failure to sustain support during selling activity could result in DOGE slipping to $0.22 or lower thus extending the current bearish phase.The 10.7% price fluctuation within 24 hours underscores increased market activity, indicating that traders are actively speculating on price movements.
Under optimistic market conditions DOGE might regain its former value between $0.26-$0.27 depending on general market sentiment stability alongside Bitcoin stability. A failure of support levels will lead to price deterioration that may extend from $0.23 to $0.22 during bearish market conditions. Overall, market sentiment, Bitcoin’s movement, and external factors will play a crucial role in determining the next direction for DOGE.


