
- If XRP manages to break through $2.75 it would trigger an upward breakout potential while testing an ascending pattern apex.
- XRP might advance past $2.75 to reach $3.20 as its main resistance level but a failed breakout would likely trigger a downward correction until it reaches either $2.41 or $2.21 or lower price areas.
- XRP maintains a bullish momentum according to MACD and RSI above 52 while performing consolidation before its future significant movement.
The approval of the XRP ETF in Brazil coincides with the United States Securities and Exchange Commission’s (SEC) acknowledgment of several spot XRP ETF filings from Nasdaq. The approval triggered a 24-hour XRP price surge following its initial spot exchange-traded fund (ETF) approval in Brazil.
Since the approval, XRP surged as of now the token is trading at $2.70, reflecting a 4.9% increase over the last 24 hours. The 24-hour price range shows that XRP has fluctuated between $2.55 and $2.74, indicating moderate volatility. The price of XRP faces immediate resistance at the $2.74 mark and a successful break could unlock additional targets going up to $2.80 or further.


XRP Faces Resistance at $2.75 Amid Ascending Triangle Formation
According to EGRAG CRYPTO, the XRP 12-hour chart analysis highlights a significant technical setup, with bulls attempting to close above the apex of an ascending triangle formation. The key resistance level at $2.75 is marked as a crucial point. A successful breakout above this level could validate a bullish continuation, potentially driving the price toward $3.20.
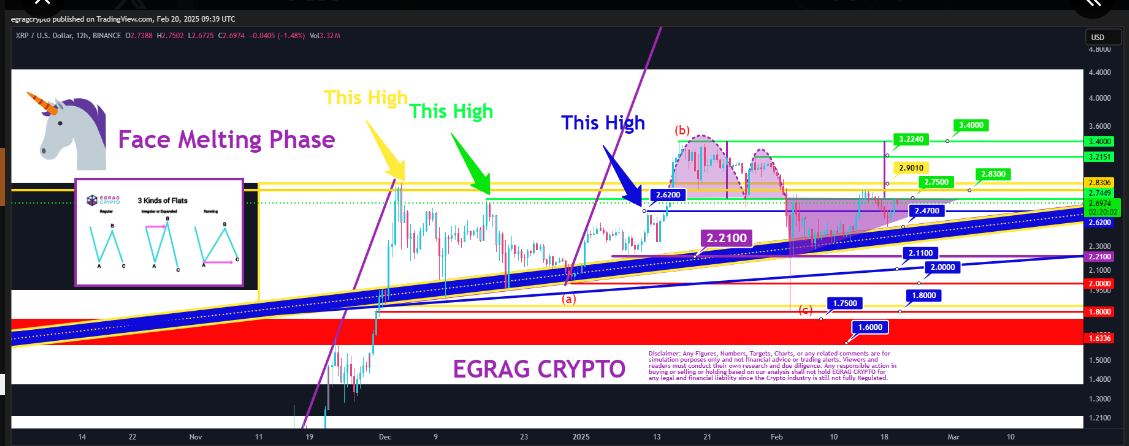
The Elliott Wave forecast indicates that XRP will finish its current Wave 2 before experiencing a potential market correction sometime in mid-March. EGRAG identifies the possibility of a (bull trap) that would result in false upward price movement followed by price reversal down with crucial support levels at $2.41, $2.21 and $2.00 in case XRP faces a retracement.
The cryptocurrency’s price history demonstrates that $2.62 and $2.75 marked two past resistance points where XRP encountered difficulties.
XRP Consolidates as Technical Indicators Show Cautious Optimism
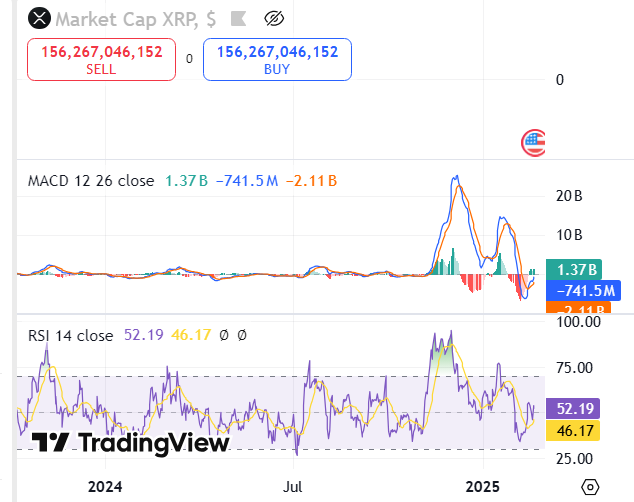
XRP’s market cap analysis reveals a phase of consolidation, with buying and selling pressures nearly balanced. The MACD indicator signals slight bullish momentum trading above the signal line, with a positive value of 1.37B.
The present RSI indicator stands at 52.19 which slightly surpasses the 50 mark demonstrating moderate market optimism. A sustained XRP price range with consistent growth potential may soon develop into a strong bullish investment opportunity.
Moreover, the upcoming phases of price movement at $2.75 will indicate if the breakout remains sustainable or if a correction happens.


