
- A major investor sold 8.71M OM for $61.23M after holding for over a year, following a 36% price surge and a 94% monthly gain.
- OM trades above the upper Bollinger Band at $7.2068, signaling strong momentum. Key resistance at $8, with upside targets at $8.50-$10.
- MACD remains bullish, with support at $7.20 (upper BB) and $6.01 (MA50). A break above $8 could push OM toward $10; failure may lead to $6.50.
A big investor has offloaded 8.71 million OM tokens, getting a profit of $61.23 million. This wallet, identified as 0x177…4fe76, had held OM for over a year.
It initially withdrew 23.83 million OM from Binance in January 2024 at an average price of $0.2261. Eleven months ago, 11.53 million tokens moved to a new address, which remained inactive until nine hours ago when part of the holdings was sent back to the exchange.


Eleven months ago, 11.53 million tokens moved to a new address, which remained inactive until nine hours ago when part of the holdings was sent back to the exchange. This follows a sharp 36% rise in OM’s price within the past 24 hours, bringing its monthly gain to 94%.
Price Surge and Key Indicators
At press time, OM was trading at $7.60. The price reached a session high of $8 before dipping to $6.8698, showing strong momentum. Trading volume has surged to 22.54 million, indicating heightened market activity.
Bollinger Bands show expanding volatility. The upper band is at $7.2068, with OM trading above it, suggesting continued bullish strength. The middle band, at $5.7354, acts as the dynamic support, while the lower band at $4.2640 offers a deeper fallback zone.
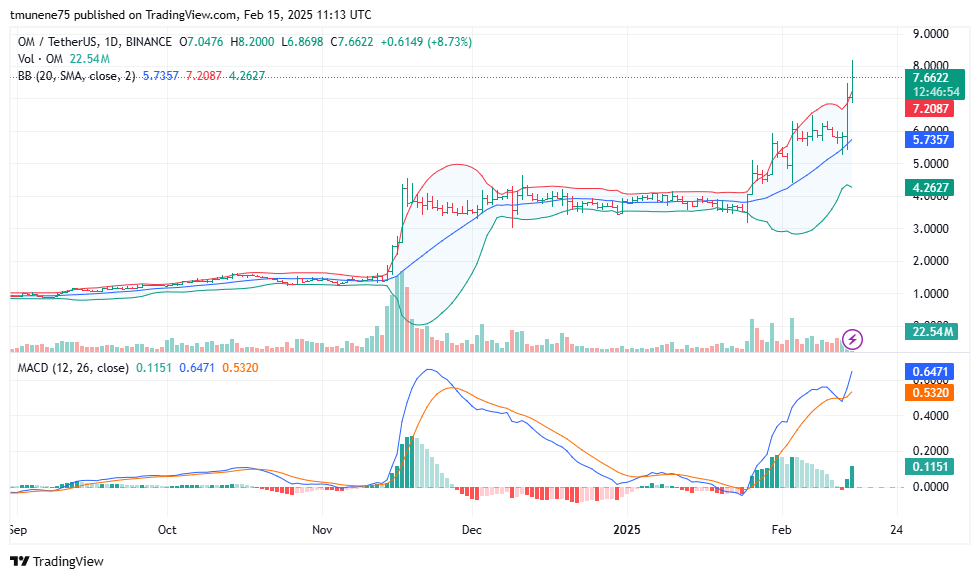
The MACD line at 0.6466 is above the signal line at 0.5319, reinforcing bullish momentum. A previous MACD crossover led to a strong rally in November, aligning with the current price patterns.
Support, Resistance, and Market Trends
The immediate support is at $7.20, aligning with the upper Bollinger Band. If OM maintains this level, upward targets between $8.50 and $10 are possible. However, a failure to sustain above $8 could lead to a retracement toward the $6.50-$7 range.
Moving averages confirm long term bullish sentiment. The 50 day moving average at $6.01 is a short term support, while the 200 day moving average (MA200) at $4.83 is the long term safety.
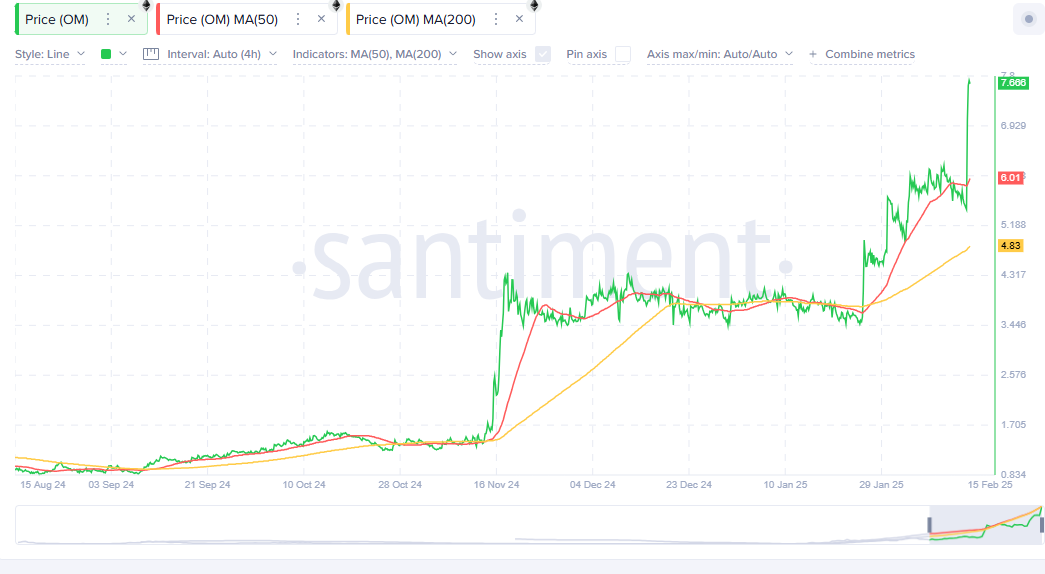
A continued hold above MA50 suggests sustained momentum, while a break below could introduce further consolidation. OM’s surge follows a period of fluctuations between $4.50 and $5.50 before its breakout.
If buying pressure continues, the next resistance at $10 could be tested. A pullback below $7, however, might suggest consolidation within the $6 to $7 range before the next move. The market’s reaction to future profit taking will be crucial in determining OM’s next direction.


