
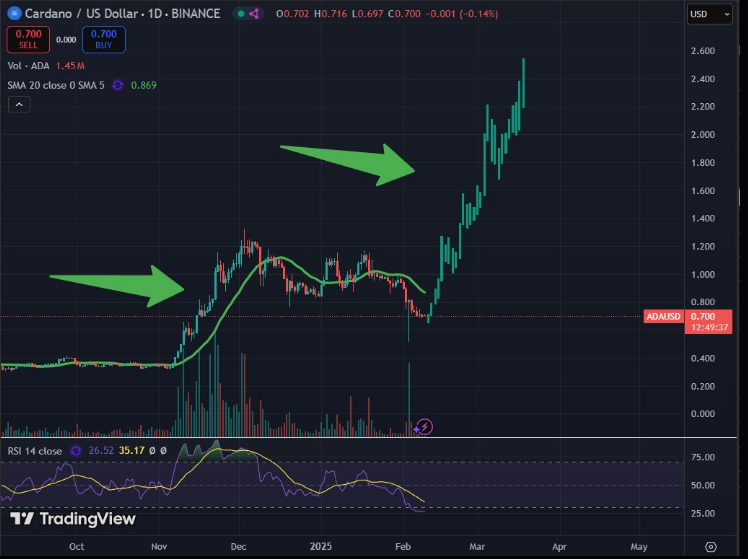
- Cardano follows a cycle of 300% rallies followed by consolidation, with another breakout potentially pushing it towards $2.50.
- The 20-day SMA serves as a key support, while RSI recovery and rising volume suggest strong bullish momentum.
- A rise in open interest could fuel ADA’s next price surge, with volatility likely increasing as speculative interest grows.
Cardano may be on the verge of a major breakout, mirroring the explosive 300% move exhibited in Nov-Dec according to crypto analyst Sssebi.
Cardano ($ADA) is showing strong bullish momentum, following a historical pattern of explosive moves followed by consolidation. Based on the chart analysis, $ADA recently experienced a 300% surge in price from October to December 2024, peaking before a corrective phase. This consolidation period lasted through January and early February, but the latest market movements suggest another major breakout is imminent.


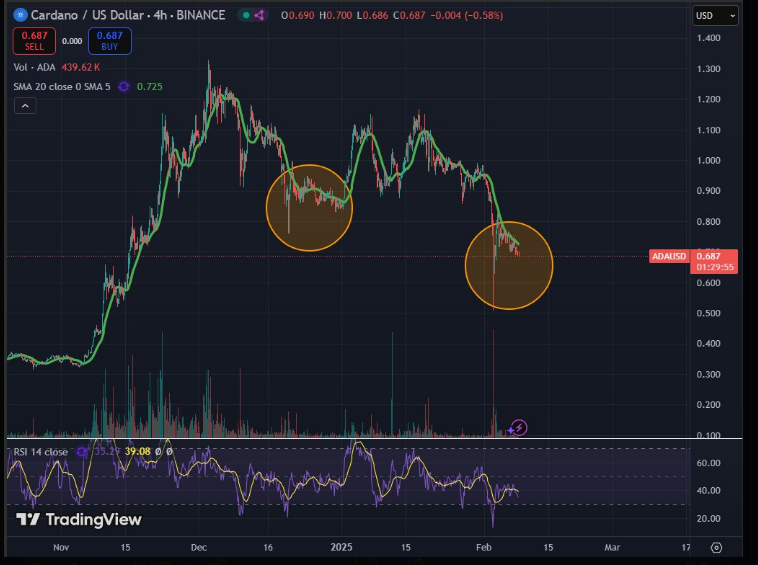
20-Day SMA as a Key Support: The Driving Force Behind ADA’s Uptrend
The 20-day simple moving average (SMA) has acted as a dynamic support level, guiding previous uptrends. In both the November-December rally and the ongoing uptrend, $ADA surged well above this SMA before retracing. The latest breakout sees $ADA pushing past the previous resistance zones, currently heading towards the $2.50 target, which aligns with a potential 250%-300% rally from recent lows.
Volume analysis indicates a resurgence of buying interest, with significant spikes mirroring the start of the prior bull run. The Relative Strength Index (RSI) recently dipped into oversold territory before recovering, suggesting renewed bullish strength. Historically, $ADA tends to make sharp vertical moves once momentum builds, making a parabolic rise to $2.50 and beyond a strong possibility.If this trend continues, $ADA could enter a new price discovery phase, potentially testing $3.00 or higher in Q2 2025.
Futures Trading Influence: How Speculation Drives ADA’s Volatility
According to data from Coinglass, open interest remained relatively low from November to mid-September, fluctuating between $200M and $600M, while ADA’s price ranged between $0.30 and $0.60. However, in late September to early January, a significant surge in both open interest and price was observed, with ADA peaking around $1.40 and open interest surpassing $1.50B. This phase indicated heightened speculative interest, with increased futures trading contributing to strong bullish momentum.
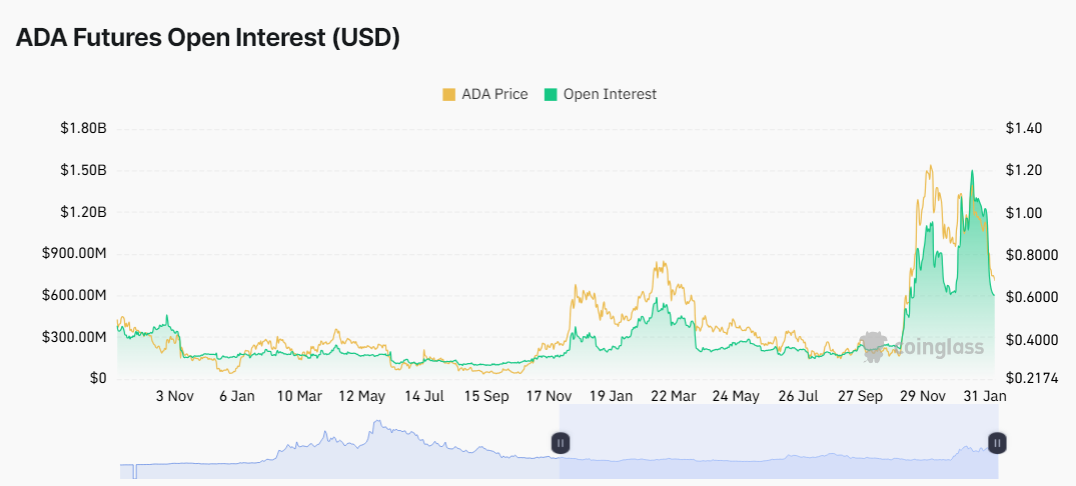
This suggests that many traders closed their positions, either due to profit-taking or forced liquidations, leading to reduced speculative pressure. The correlation between rising open interest and price spikes implies that as futures activity increases, ADA tends to experience stronger volatility. If open interest begins to rise again while ADA stabilizes, it could signal the start of another bullish wave, potentially pushing the price toward $1.50-$2.00 in the coming months.


