
- A 470% increase in token burns saw 15.1M SHIB removed from circulation in 24 hours, yet price impact remains minimal.
- SHIB price has dropped 28.8% this month, with weak RSI (34.62) and MACD indicators signaling continued bearish momentum.
- Despite the bearish trend, weakening selling pressure suggests a possible rebound if MACD crosses above the signal line.
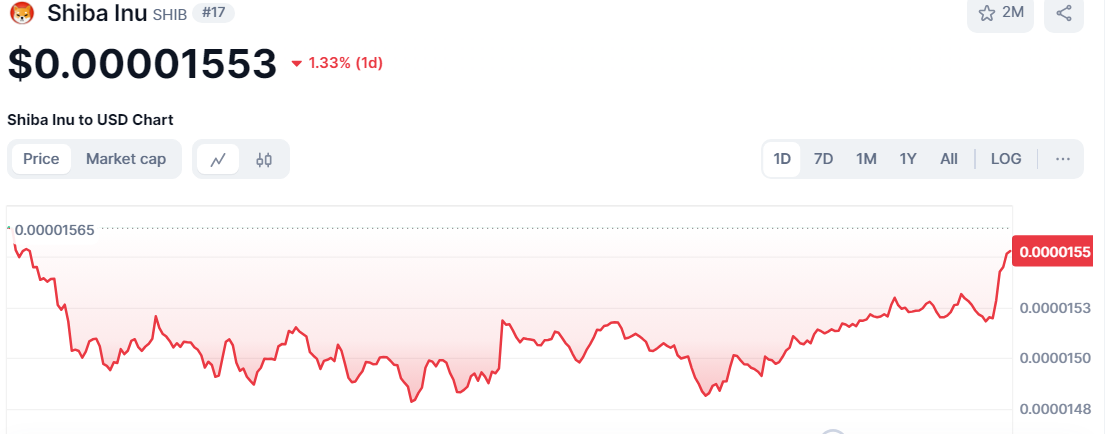
Recent token burn activities resulted in another decrease in Shiba Inu (SHIB) circulating supply. Shiba Inu (SHIB) has seen notable price fluctuations.At the time of writing,SHIB was trading at $0.00001553.The price has declined by 1.33% today and 28.8% since the start of the month.


Shiba Inu’s Fiery Comeback: Token Burns Skyrocket Over 470%
According to Shibburn data,Over 470% surge in Shiba Inu burn rate occurred during the 24 hours bringing a total of 15,104,251 tokens.Thus, Over the past week,76.17 million SHIB tokens have been burnt recording a decline of -93.35%. So far, 15,104,251 SHIB tokens have been burnt from the 589,255,626,629,059SHIB circulating supply bringing its market cap to a decline of -4.16%.
The price surges result from increased demand for the meme coin through this mechanism. However, recent Shiba Inu coin burns have not produced any notable effect on token value. The market sentiment along with broader market bears control the current SHIB trading which remains below its essential levels.
SHIB Technical Indicators ,Bearish Momentum Persist
Current SHIB daily business transactions display uncertain market patterns. Open prices for the day reached $0.00001868 followed by a maximum mark of $0.00001575 and a minimum value $0.00001481 with 1.4% BTC value decrease.
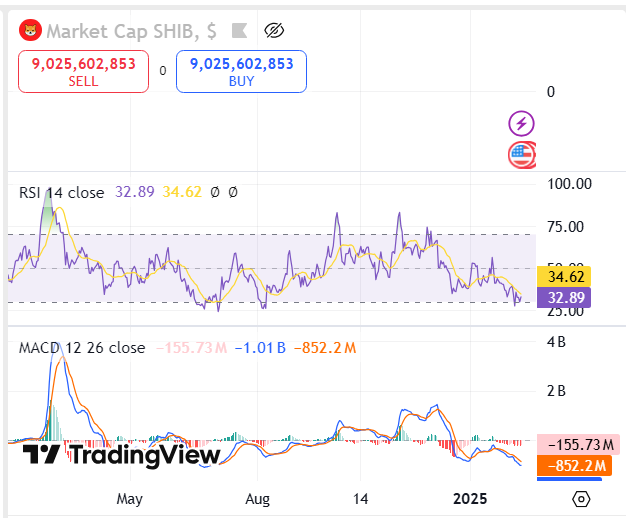
Currently, technical indicators contribute to the ongoing bearish momentum. The RSI is currently at 34.62, below the neutral level, suggesting weak buying strength. A rise above 40-45 would indicate stronger bullish momentum, while remaining below 40 could suggest continued weakness.The MACD indicator is trading below the signal line also pointing to a bearish momentum.
The MACD line maintains its position below the signal line yet the histogram bars show signs of contraction which indicates weakening selling force. If the MACD crosses above the signal line, it may indicate a short term recovery.
SHIB Price Outlook
The decreasing trend serves as evidence that investors are removing their assets because of profit-making behavior or wider market developments. If SHIB manages to break above the $0.00001574 resistance level, it could push towards $0.00001600 or even $0.00001620, assuming a bullish market reaction. On the other hand, if the price falls below the $0.00001481 support, further declines to $0.00001450 or lower are possible.


