
- ETH’s RSI hit 84.3, leading to $1.79B in long liquidations as profit taking and overbought conditions drive short term pullback.
- Bitcoin dominance rose to 60.4%, reducing altcoin demand; ETH’s funding rates and Altcoin Season Index also declined.
- ETH must break $3,900 to push toward $4,050; failure may lead to correction toward the $3,720–$3,750 support range.
Ethereum (ETH) posted a minor pullback on July 29, trading at $3,878, down by 0.24% over the past 24 hours. Despite the dip, the asset gained by 6.37% in the past week and surged by 58.67% in the past month.
However, recent data shows profit taking, resistance near key technical levels, and a sharp rise in Bitcoin dominance have all contributed to the current decline. These market factors are prompting traders to reassess short term strategies, with critical levels now in focus.


Overbought Signals and Profit Taking Lead to Dip
Ethereum’s sharp monthly climb pushed its technical indicators into overheated levels. On July 28, ETH’s RSI7 reached 84.3, the highest level since May 2025. This surge preceded a wave of profit taking, resulting in approximately $1.79 billion in long position liquidations since July 22.
The price also faced resistance at $3,876, nearly matching the July 27 high. Notably, this level aligns with the 1.618 Fibonacci extension zone at $3,906, capping further upward movement.
Bitcoin Dominance Rises, Pulling Liquidity from Alts
Another factor affecting ETH’s price action is the rise in Bitcoin’s market dominance. According to CoinMarketCap, BTC’s dominance increased by 0.17% in 24 hours to 60.4%. This trend shows a shift of capital back into Bitcoin, reducing appetite for altcoins like ETH.
The Altcoin Season Index fell to 41, down by 18% week-on-week, showing weakening investor confidence in alternative assets. Perpetual funding rates for ETH also dropped from 0.011% to 0.0094%, suggesting cooling sentiment and reduced leverage demand across derivatives platforms.
Price Pattern Breakout and Indicator Movements
ETH recently broke out of a rising wedge, a formation typically seen before downward moves. Despite this, the token continued its ascent, supported by sustained buying momentum.
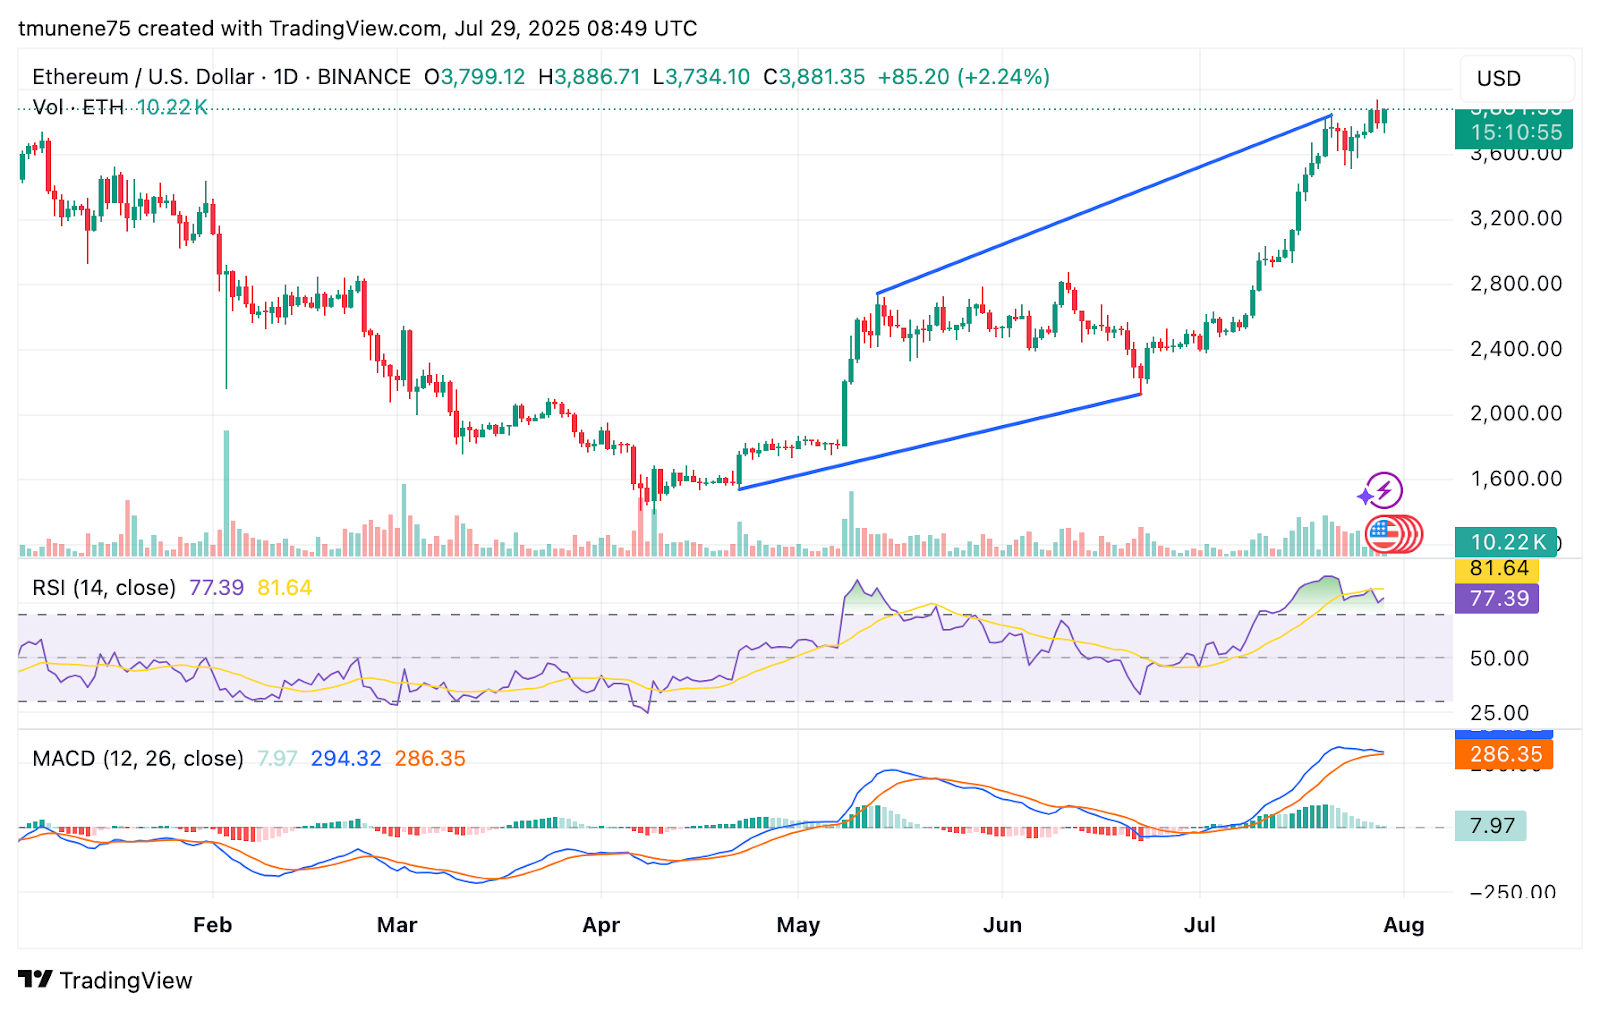
Daily trading volume held at 10.22K ETH, though it lacked any sharp spike that would confirm renewed whale accumulation. MACD indicators remain positive, with the MACD line at 294.41 above the signal line at 286.36.
The histogram shows a slight bullish momentum of 8.05. However, a narrowing gap hints at a possible cooldown phase ahead. RSI is at 77.42, still in overbought levels, which may limit short term upside.
Potential Price Ranges for July 30
If ETH breaks and holds above $3,900, it could rally toward $3,950 or even test $4,050. A confirmed breakout may push the price to the $4,000 psychological level.
However, if sellers reject the current highs, ETH may correct to the $3,720–$3,750 zone. This support range aligns with recent liquidation levels and a technical cooldown from overbought conditions.
Final Overview
Ethereum’s latest pullback indicates technical rebalancing after a strong rally, impacted by resistance, long liquidations, and Bitcoin strength. While short term overbought indicators persist, the market eyes $3,900 level for the next direction. Funding rates, RSI movement, and volume changes will likely guide trading setups in the short term.
Disclaimer : The content shared by The Daily Crypto Post is intended for informational and educational purposes only and does not constitute financial or investment advice. Readers are encouraged to do their own research or consult with a licensed professional before making any financial decisions. The Daily Crypto Post will not be accountable for any financial losses.


