
- USTC forms bullish descending wedge, signaling potential 450% rally to $0.081
- RSI at 64.37 and rising MACD indicate growing bullish momentum in USTC price
- Price compression near $0.0143 suggests imminent breakout as volume consolidates
TerraClassicUSD (USTC) is catching attention as it inches closer to a key technical breakout that could ignite a major rally. Technical patterns suggest the digital asset might be ready to escape months of downward pressure. According to analyst JAVON⚡️MARKS, the chart is forming a descending wedge a bullish reversal signal.
If USTC breaks out from this pattern, it may climb toward the long-standing target of $0.081, marking a remarkable 450% gain from current levels. This momentum shift could breathe new life into Terra Classic’s community, which has weathered prolonged price stagnation and high volatility.


$USTC (Terra Classic USD) prices look to be nearing a bullish breakout of falling wedge-like structure and this could spark a huge run towards the long-standing ~$0.081 target!
— JAVON⚡️MARKS (@JavonTM1) July 16, 2025
This target is currently over 450% away… https://t.co/orAGS8Rg5S pic.twitter.com/5zgkVyEssf
Price Action and Technical Landscape
USTC is currently priced at $0.01412, with a 24-hour volume of $7.62 million, down more than 30%. Market participants appear cautious but still engaged. The recent price movement remains largely sideways, moving within a narrow band. This reflects indecision but also sets the stage for a breakout as pressure builds near the wedge apex.
The wedge formation is gradually compressing the price action. Historically, this structure tends to precede strong upward momentum. Immediate resistance sits at $0.0143, a level tested multiple times but never clearly breached.
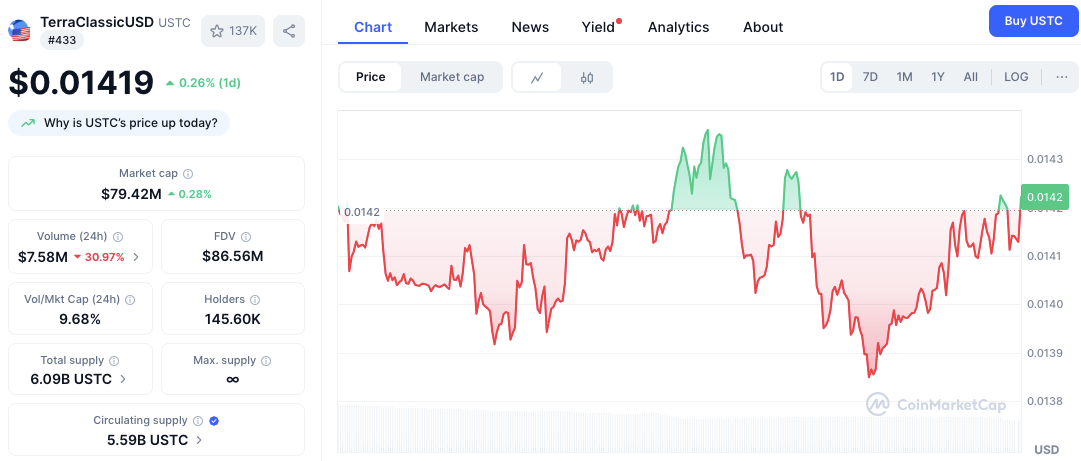
The next barrier lies at $0.017. A successful move beyond these levels could quickly push prices higher toward the $0.081 target.
Support remains firm at $0.01385 to $0.0139, where the price has bounced multiple times. These levels are critical for bulls to maintain upward potential.
Momentum Indicators Point to Cautious Optimism
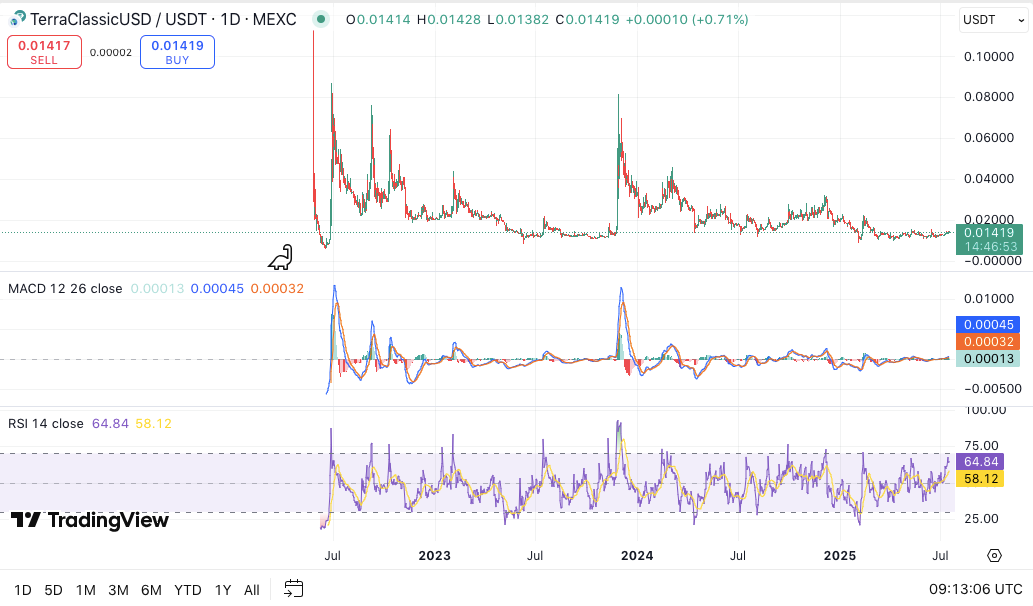
Technical indicators also reflect growing bullish potential. The MACD currently shows mild positive momentum, with the MACD line at 0.00013 and the signal line at 0.00032. The histogram points to neutral-to-slightly bullish behavior, hinting at speculative buildup.
Meanwhile, the RSI stands at 64.37, hovering just below the overbought threshold of 70. This suggests there’s still room for upside before traders begin taking profits. Historically, USTC rallies have pulled back when the RSI exceeds 70, so any surge must be monitored carefully.


